Solaris IO latency
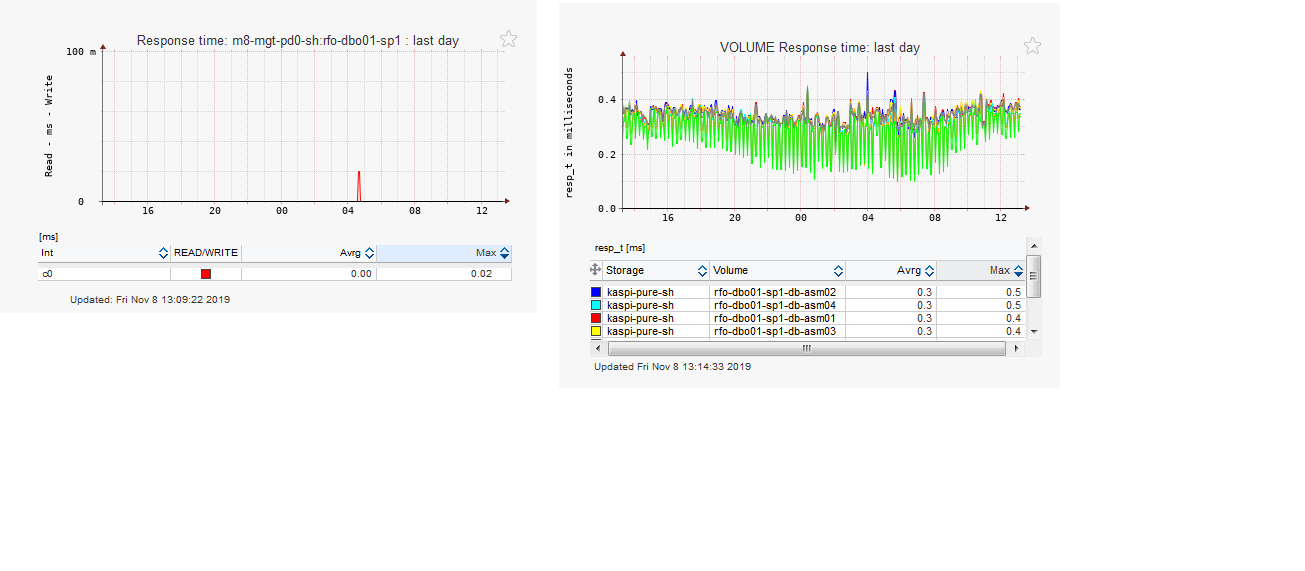
Hi! We are using lpar2rrd on VMWare and IBM Power environment, it works great! Recently we have bought a new SPARC M8 server, and sight incorrect IO latency data from solaris ldoms. And also we do not receive data on network traffic from agents.
Comments
-
Hi,lpar2rrd server and OS agent versions.
-
LPAR2RRD server and agent version is 6.10
-
Hi,can you upgrade to the latest 6.11 (server) and 6.11-3 (agent)?There is a lot of improvements in Solaris like new presentation in the menu tree.Also several bugs was fixed, it sounds like one of it.Let us know.
-
Of course i will install updates! Thank you!
-
 Hi, Pavel! I have upgraded lpar2rrd server and agent, now i can see network traffic statistic and new presentation in the menu tree. It looks good! IO latency statistic still incorrect. In the attachment, I outlined my assumptions why this is happening.
 -
ok, got it, we need to do this to compute total latency from your iostat output
svc_t = wsvc_t + asvc_t
svc_t: average response time of transactions, in milliseconds
The svc_t output reports the overall response time, rather than the service time, of a device. The overall time includes the time that transactions are in queue and the time that transactions are being serviced. The time spent in queue is shown with the -x option in the wsvc_t output column. The time spent servicing transactions is the true service time. Service time is also shown with the -x option and appears in the asvc_t output column of the same report.wsvc_t: average service time in wait queue, in milliseconds
asvc_t: average service time of active transactions, in milliseconds
Howdy, Stranger!
Categories
- 1.7K All Categories
- 126 XorMon
- 26 XorMon Original
- 176 LPAR2RRD
- 14 VMware
- 20 IBM i
- 2 oVirt / RHV
- 5 MS Windows and Hyper-V
- Solaris / OracleVM
- 1 XenServer / Citrix
- Nutanix
- 8 Database
- 2 Cloud
- 10 Kubernetes / OpenShift / Docker
- 141 STOR2RRD
- 20 SAN
- 7 LAN
- 19 IBM
- 8 EMC
- 12 Hitachi
- 5 NetApp
- 17 HPE
- 1 Lenovo
- 1 Huawei
- 3 Dell
- Fujitsu
- 2 DataCore
- INFINIDAT
- 4 Pure Storage
- Oracle