Strange things after 5.00 upgrade
Hi,
First of all thanks for the continuous development!
The new version has some oddities:
- in case of Chrome (v. 56.0.2924.87) there are some display problem (instead of colors there are color codes, historical report forms are empty, Diagram category names are stacked vertically)
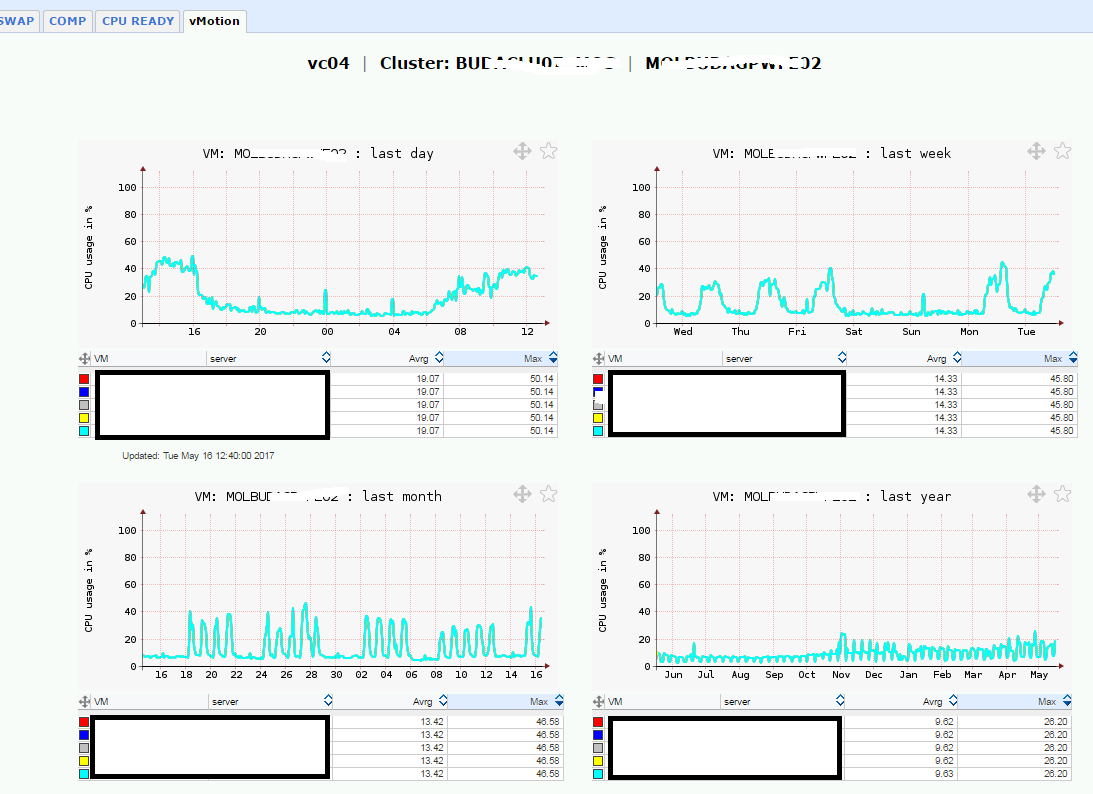
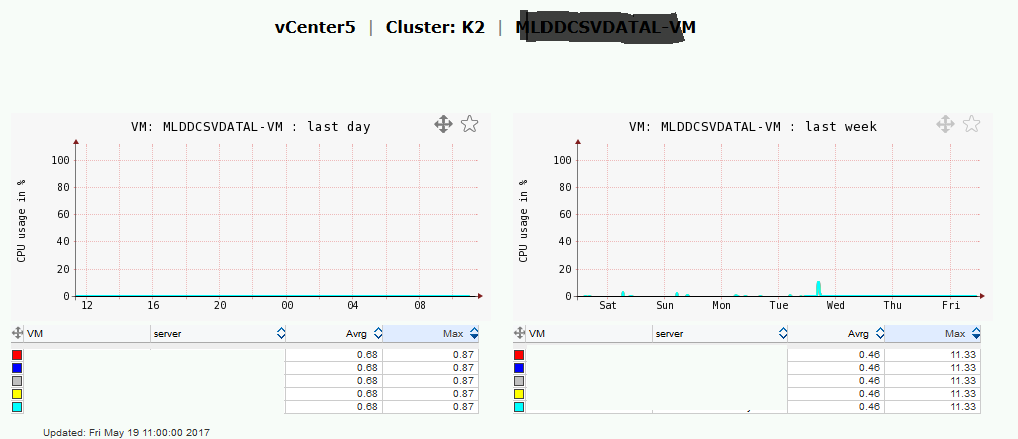
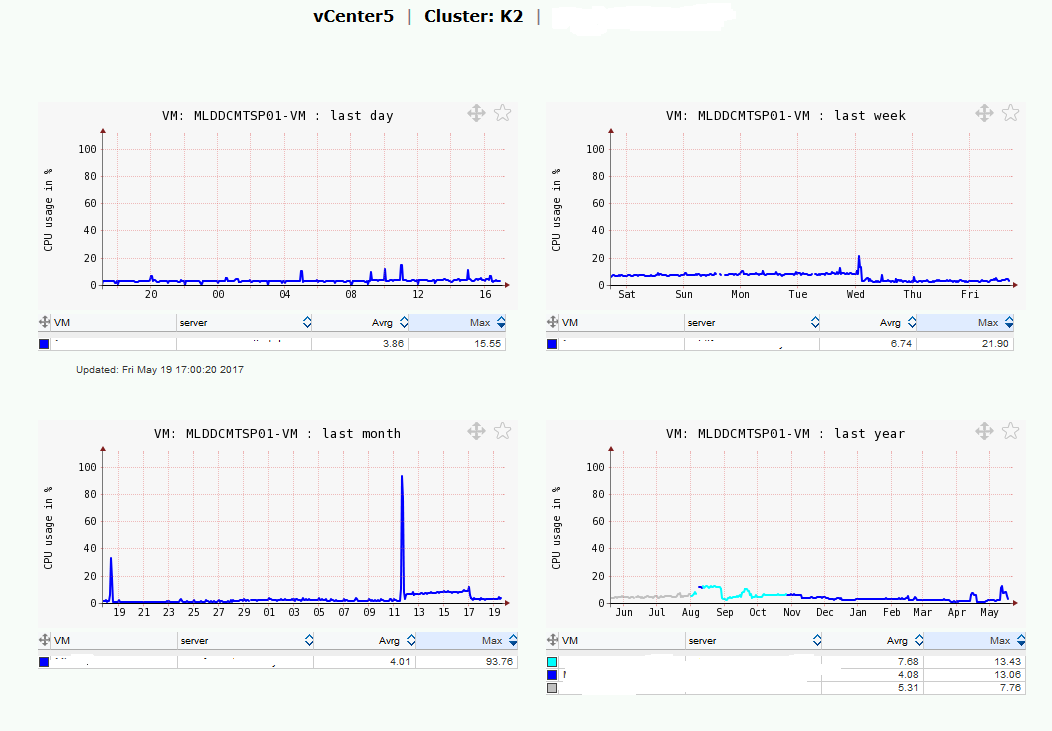
- vMotion charts are wrong
- in case of CPU Ready chart the 1-100% scale is not usefull because of the small values
Comments
-
Hi Zoltan
- in case of Chromeplease try to force refresh (Ctrl-F5) page, it should help. If it doesn't, try this:
- Click or tap on any open Chrome browser window to make it
active.
- Press "Ctrl-Shift-Delete" together.
- Select the "Empty the cache" only
- Choose a period of time from the drop-down menu at the top. Select "the beginning of time" to erase all the cached data
- Click or tap "Clear browsing data."
if you do not have CPU Ready problem, you can see almost nothing,
otherwise you can see the CPU Ready graph (we have seen 20-30% problem graph)
so we feel it is OK
- in case of Vmotion chart: cas you specify what is wrong?
thanks
- Click or tap on any open Chrome browser window to make it
active.
-
Thanks, the Crtl-F5 worked, and the CPU ready is ok.
Can you send me an email address? I will send you a picture about the vMotion issue.
Zoli -
As you can see, there is no colors, and all the charts show the same 'vMotion' list.
Zoli
-
I have the same situation on my installation

-
use this as a fix:
http://www.lpar2rrd.com/download/detail-graph-cgi.pl.gz
Gunzip it and copy to /home/lpar2rrd/lpar2rrd/bin (755, lpar2rrd owner)
-rwxr-xr-x 1 lpar2rrd staff 488643 May 19 19:45 bin/detail-graph-cgi.pl
If your web browser gunzips it automatically then just rename it: mv detail-graph-cgi.pl.gz detail-graph-cgi.pl
-
now work fine, thanks!!

Howdy, Stranger!
Categories
- 1.7K All Categories
- 115 XorMon
- 26 XorMon Original
- 171 LPAR2RRD
- 14 VMware
- 19 IBM i
- 2 oVirt / RHV
- 5 MS Windows and Hyper-V
- Solaris / OracleVM
- 1 XenServer / Citrix
- Nutanix
- 8 Database
- 2 Cloud
- 10 Kubernetes / OpenShift / Docker
- 140 STOR2RRD
- 20 SAN
- 7 LAN
- 19 IBM
- 7 EMC
- 12 Hitachi
- 5 NetApp
- 17 HPE
- 1 Lenovo
- 1 Huawei
- 3 Dell
- Fujitsu
- 2 DataCore
- INFINIDAT
- 4 Pure Storage
- Oracle