after 6.20 -> 7.20 upgrade vmware heatmap have too many grey vm/server etc. - "nan" values

Comments
-
Hi,can you see actual data in graphs?
-
Hi,Yes.
-
Hi,1. send us screenshot(s) to document the issue2. logsNote a short problem description in the text field of the upload form.
cd /home/lpar2rrd/lpar2rrd # or where is your LPAR2RRD working dir
tar cvhf logs.tar logs tmp/*txt tmp/*json
gzip -9 logs.tar
Send us logs.tar.gz via https://upload.lpar2rrd.com
-
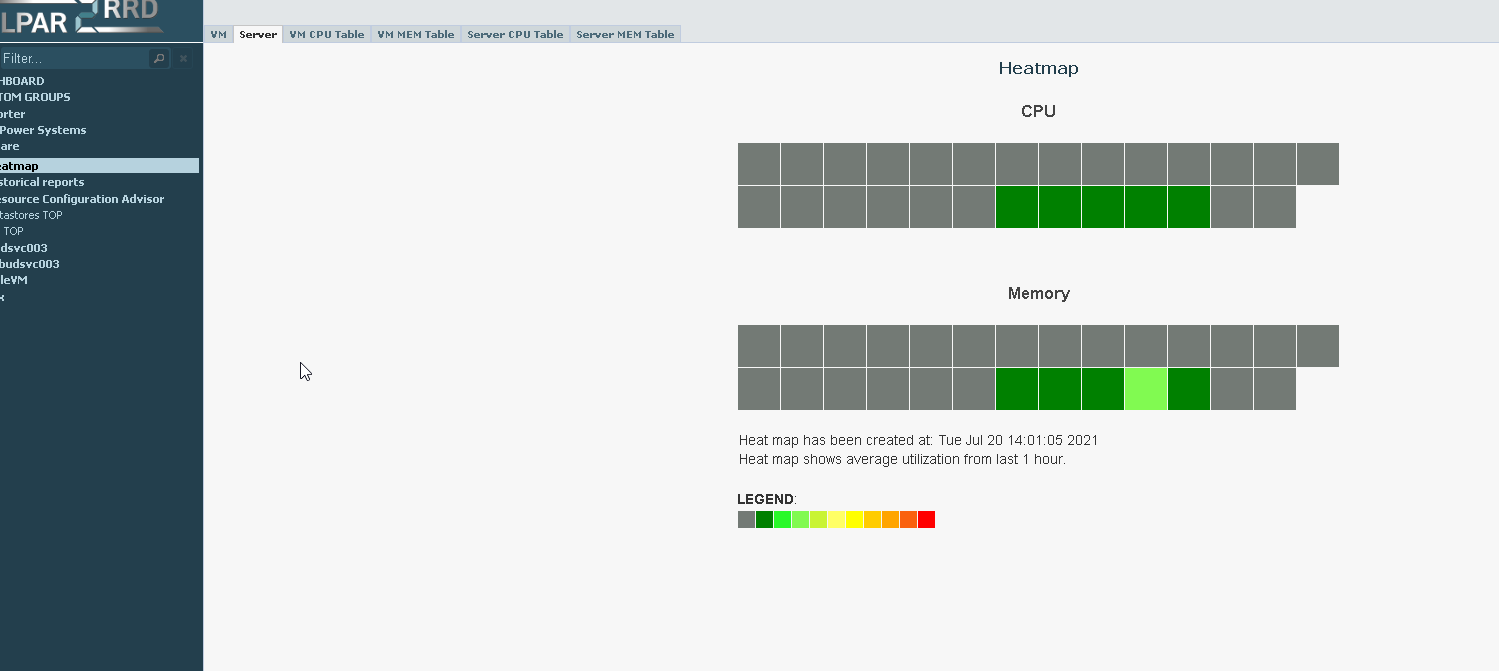
1 the screenshots:too many green vm / server at the vmware heatmap - ver 6.20 -> 7.20

-
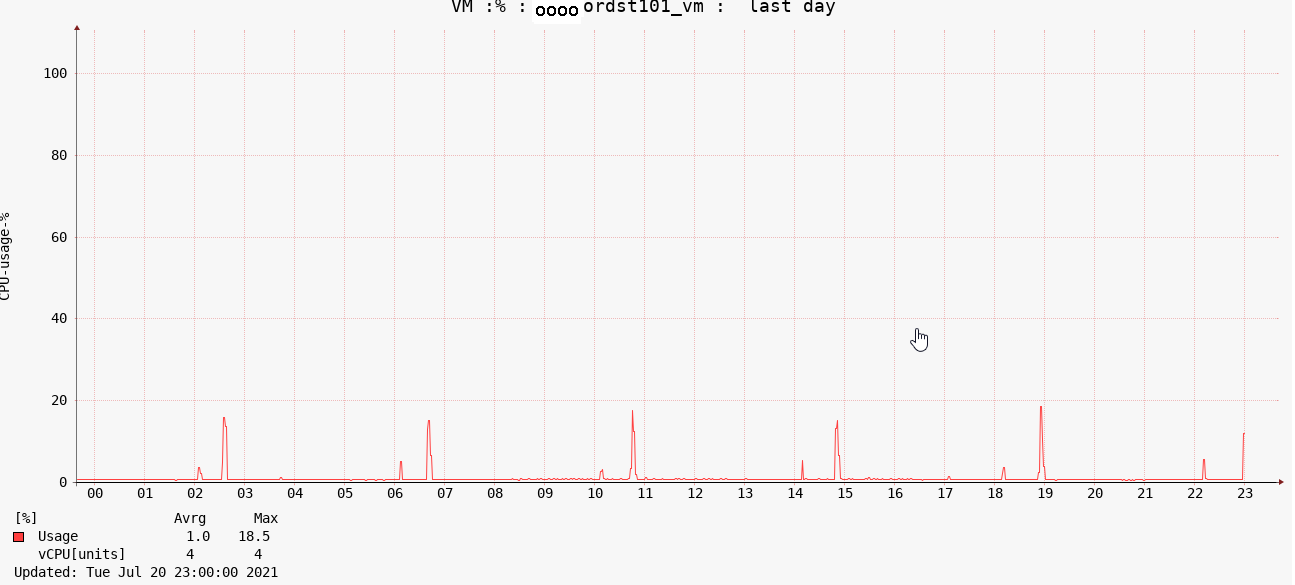
screenshot of one VM, CPU daily graph
-
I have uploaded the logs, anyway some datas have masked before.
-
I'm sorry, not green - grey...cpu daily
 screenshots here
 -
In your case change your crontab load line from one hour to 30 minutesfrom# LPAR2RRD UI
# LPAR2RRD UI
0 * * * * /home/lpar2rrd/lpar2rrd/load.sh > /home/lpar2rrd/lpar2rrd/load.out 2>&1to
0,30 * * * * /home/lpar2rrd/lpar2rrd/load.sh > /home/lpar2rrd/lpar2rrd/load.out 2>&1wait one hour, it should help -
I'm set, now waiting for...
-
Great! I think that was the solution.Anyway, in the next lpar2rrd release that crontab timing will be the default?

-
No, default crontab load is 1 hour,it is ok for most users,on some rare occassions it must be changed
-
Ok, thanks, and thanks for Your help!


Howdy, Stranger!
Categories
- 1.7K All Categories
- 131 XorMon
- 26 XorMon Original
- 178 LPAR2RRD
- 14 VMware
- 20 IBM i
- 2 oVirt / RHV
- 5 MS Windows and Hyper-V
- Solaris / OracleVM
- 1 XenServer / Citrix
- Nutanix
- 8 Database
- 2 Cloud
- 10 Kubernetes / OpenShift / Docker
- 142 STOR2RRD
- 20 SAN
- 7 LAN
- 19 IBM
- 8 EMC
- 12 Hitachi
- 5 NetApp
- 17 HPE
- 1 Lenovo
- 1 Huawei
- 3 Dell
- Fujitsu
- 2 DataCore
- INFINIDAT
- 4 Pure Storage
- Oracle