Inconsistencies for data rate for nodes and for ports (cdot)

Hello,
we have inconsistencies for some of our NetApps in the representation of the data rate for the nodes and for the ports.
In
this example there is only throughput for node A and nothing for B.
There seems to be also a
wrong label for the Y axis: about a factor 1000 to small compared to the real
values, which can be seen for example in the picture for the rate by protocol.


In contrast, the picture for the ports shows node B (e0h/e0g) with throughput.

In Grafana the ports are displayed correctly.
We
have two FAS8200 (ONTAP 9.5P8 resp. 9.5P6) with this behaviour, and two FAS8200
(ONTAP 9.5P8 resp. 9.5P6), where it looks ok.
And
there is also a FAS2750 (9.5P6) with these inconsistencies.
I’ve also upgraded STOR2RRD to 8.21-16 without improvement.
Regards,
Arndt
Comments
-
Hi,send us logs, note storages names, proper one and wrong oneNote a short problem description in the text field of the upload form.
cd /home/stor2rrd/stor2rrd # or where is your STOR2RRD working dir
tar cvhf logs.tar logs tmp/*txt
gzip -9 logs.tar
Send us logs.tar.gz via https://upload.stor2rrd.com
-
Hi,
I’ve uploaded logs.tar.gz as well as details.txt with details.The issue with the wrong label for the Y axis appears for all NetApps.
Thanks
-
Hi Arndt,
we need some raw perf data from affected Netapp, can you please do following steps:su - stor2rrd cd /home/stor2rrd/stor2rrd echo "export DEBUG_FULL=2" >> etc/.magic
Wait for 15 minutes, then:cd /home/stor2rrd/stor2rrd tar cvf dump.tar data/<YOUR_NETAPP>/*.dump gzip -9 dump.tar
please replace <YOUR_NETAPP> with affected netapp name
Send us dump.tar.gz for analysis ( https://upload.stor2rrd.com )
Don't worry, there will be no private content in that file.
Don't forget to remove etc/.magic , or just comment out line containing DEBUG_FULL=2rm etc/.magic
Thanks in advance
-
Hi Jirka,
I’ve uploded the data for all NetApps.
Is it possible that there is a missing assignment for the ports to the node_name as seen in the *cli.dump, like it is there for processor or fcp_lif?
-
Hi Arndt,
I can see data for both nodes only in mshnap1 and mshnap2 dumps, others has non-zero values for only one of them (either A or B ) - that's what we present in graphs.
Please check it on your dumps:cd data/oggnap10
Ad bad y-axis scale: I have to made some calculations on dumps you send, I'll reply on it ASAP
grep -e 'system:node' *cli.dump
-
Hi Jirka,
your grep for oggnap10 is ok, and also that nearly all throughput is on node A and nothing on node B. This corresponds to the reality and to the representation in STOR2RRD for the node.
The problem is, that in the representation for the ports (e0g/e0h) all throughput is on node B and nothing on A in contrast to the above.
So doing a grep in the cli.dump for e0g resp. e0h, I can’t see any assignment to a node. It seems as if the first set of values (recv-data,recv-packets,recv-errors,sent-data,sent-packets,sent-errors) belong to node A, because these are high values, and the second set belongs to node B (low values).
But in the representation for the ports it’s vice versa, as if something gets confused or has not the right assignment.
-
Hi Arndt,
you're right, there is a bug in port mapping: I've used a hash structure for nodes instead of array, so it 's mapping ports to nodes in random order. Sometimes it's good, another time it's bad :-/
I'm working on the fix. -
Great - thank you!
-
Hi Arndt,
please try this patch, it should fix node->port mapping:
https://download.stor2rrd.com/patch/2.81-21-64-g91de9/naperf.pl.gzGunzip it and copy to /home/stor2rrd/stor2rrd/bin (755, stor2rrd owner)-rwxr-xr-x 1 stor2rrd stor2rrd 110083 Sep 16 09:18 naperf.plIf your web browser gunzips it automatically then just rename it: mv naperf.pl.gz naperf.plAssure that file size is the same as on above example
Let us know please -
Hi Jirka,
at first sight it looks good.
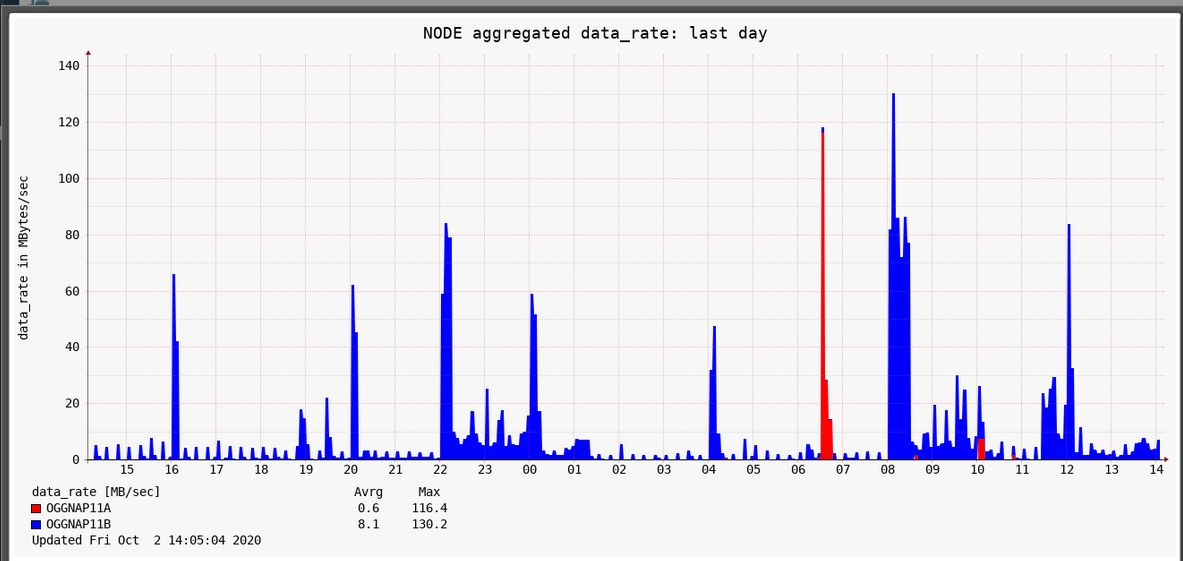
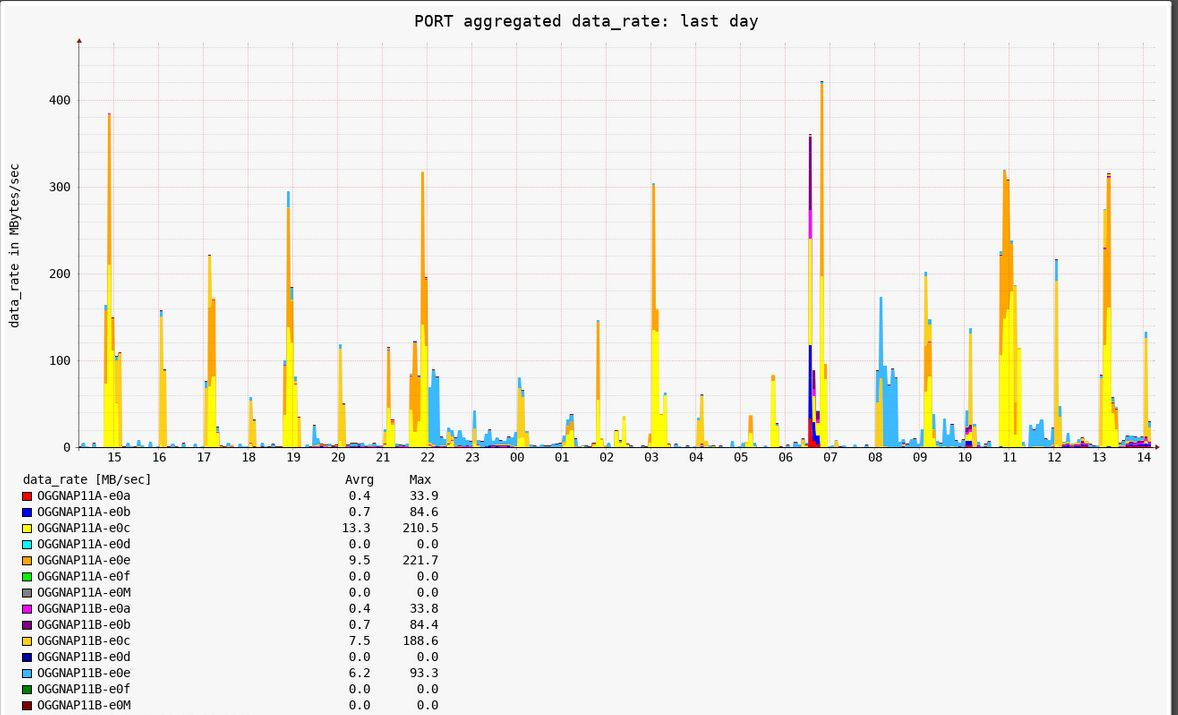
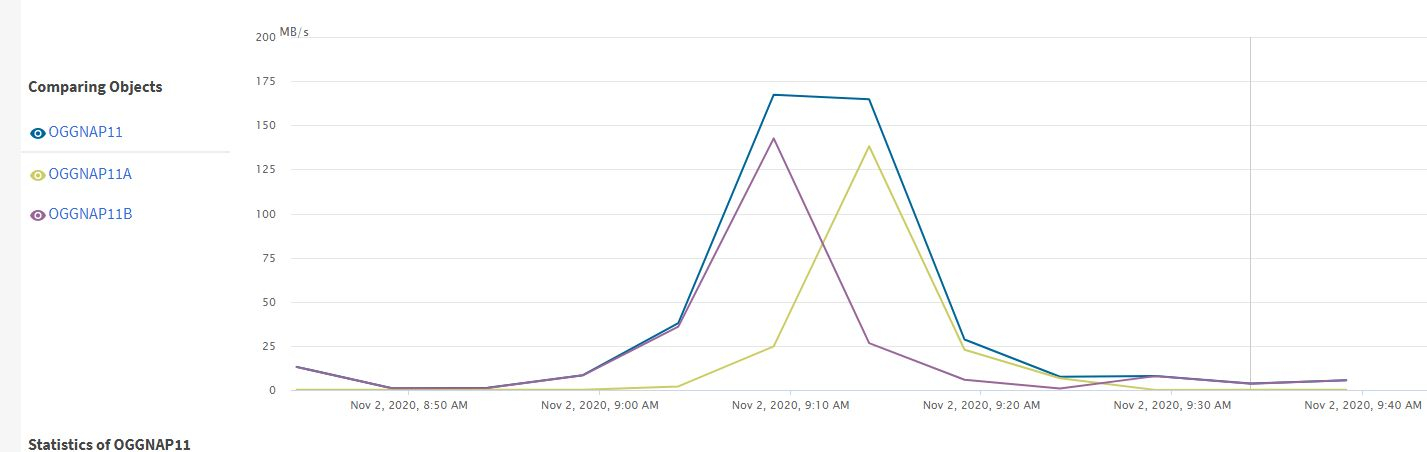
But I’ve a problem with the FAS2750 oggnap11.Below is an example for the time from about 11am to 2pm. The graphs for the data rate for the nodes and for the ports should be similar. But they are not. Especially there are contributions from ports OGGNAP11A-e0c/e which can’t be seen in the node representation.
I’ve collected new dumps (only for 10 minutes) and uploaded them.
I also wonder why I still can’t see any relationship in the dumps for the port data to the nodes, as this is the case for other objects like lif, processor, …

-
Hi Ardnt,
I've done deep analysis of your latest logs, here is my resuts.
Node ports number is a sum of all node ports throughput divided by 300 (seconds)
It's far from ideal, but some analogy can be found there:./oggnap11-20200907_1335.cli.dumpsystem:node::OGGNAP11A::read_data::0KB::-::-::system:node::OGGNAP11A::write_data::0KB::-::-::system:node::OGGNAP11B::read_data::2297KB::-::-::system:node::OGGNAP11B::write_data::72KB::-::-::Node A ports recv-data: 24.16KB/sNode A ports sent-data: 59.95KB/sNode B ports recv-data: 237.71KB/sNode B ports sent-data: 2529.74KB/s./oggnap11-20200907_1340.cli.dumpsystem:node::OGGNAP11A::read_data::0KB::-::-::system:node::OGGNAP11A::write_data::0KB::-::-::system:node::OGGNAP11B::read_data::8KB::-::-::system:node::OGGNAP11B::write_data::39KB::-::-::Node A ports recv-data: 21.20KB/sNode A ports sent-data: 38.34KB/sNode B ports recv-data: 145.04KB/sNode B ports sent-data: 103.01KB/s./oggnap11-20200907_1345.cli.dumpsystem:node::OGGNAP11A::read_data::0KB::-::-::system:node::OGGNAP11A::write_data::0KB::-::-::system:node::OGGNAP11B::read_data::0KB::-::-::system:node::OGGNAP11B::write_data::4202KB::-::-::Node A ports recv-data: 19.35KB/sNode A ports sent-data: 32.13KB/sNode B ports recv-data: 4328.95KB/sNode B ports sent-data: 127.12KB/s
I've made some changes in node data calculations, there were some unnecessary adjustments, IMHO because our Netapp simulator sends completely confusing node data.
Please try to install this patch and let us know please if it's better:Gunzip it and copy to /home/stor2rrd/stor2rrd/bin (755, stor2rrd owner)-rwxr-xr-x 1 stor2rrd stor2rrd 110136 Sep 21 10:25 naperf.pl
If your web browser gunzips it automatically then just rename it: mv naperf.pl.gz naperf.plAssure that file size is the same as on above example -
Hi Jirka,
thank you for your analysis. I’ve installed the patch and will check it.
At the moment I’m out of office until next week Wednesday. So possibly you will get no feedback from me in the meantime.It still seems that the graphs for the data rate for the nodes and for the ports are not similar for oggnap11 and that there are discrepancies.
I also saw that you corrected the y-axis scale.
I’ll take a further look and reply end of next week at the latest.
-
Hi Jirka,
I’m back and checked the data resp. the graphs.
I’ll think now it looks good for the port data rate and your fix works!
But there is still one issue I can’t explain and which I mentioned in my last post: for the FAS2750 oggnap11 the node data rate doesn’t really fit to the other data rates.
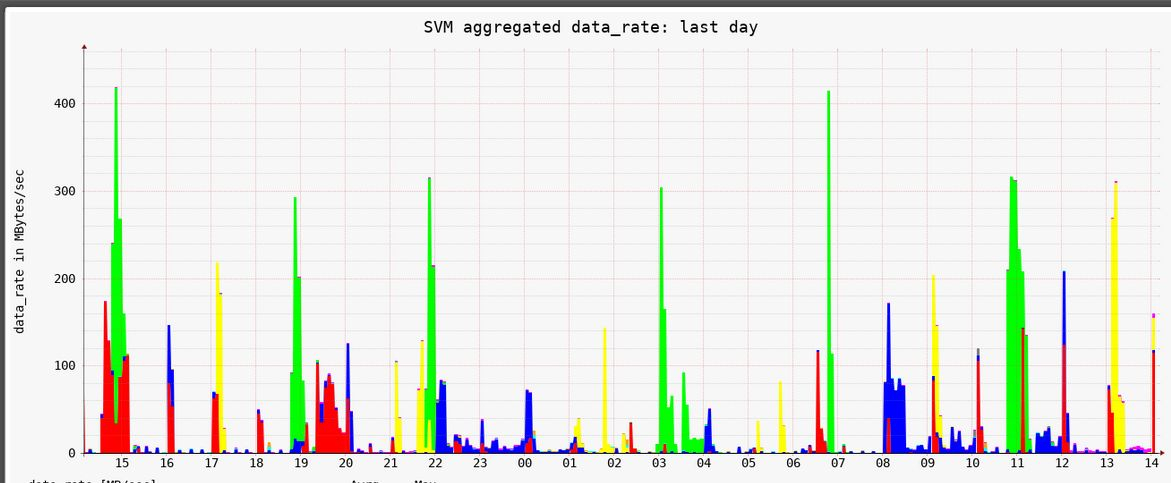
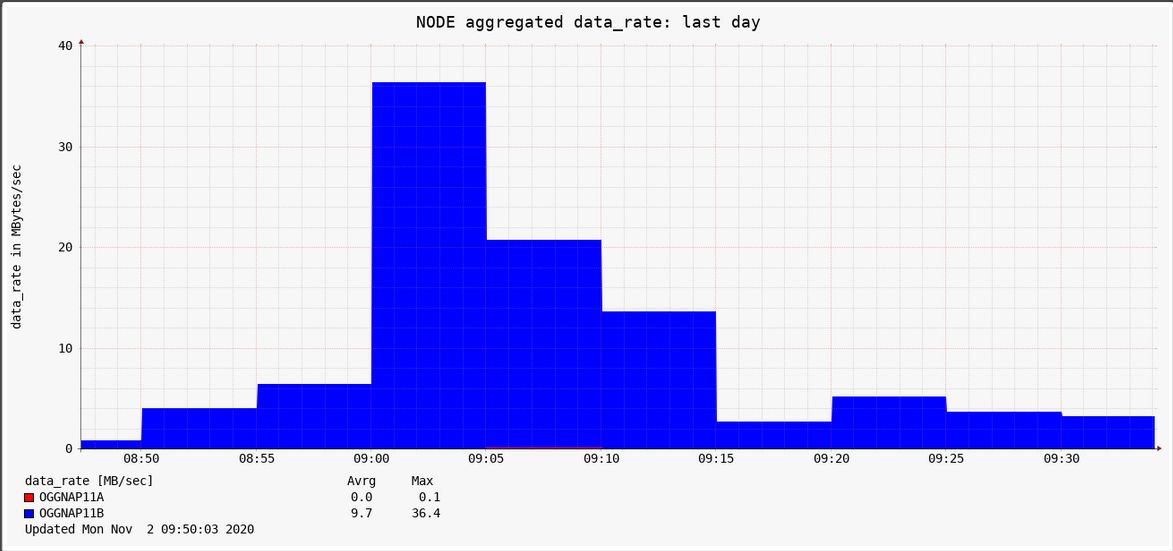
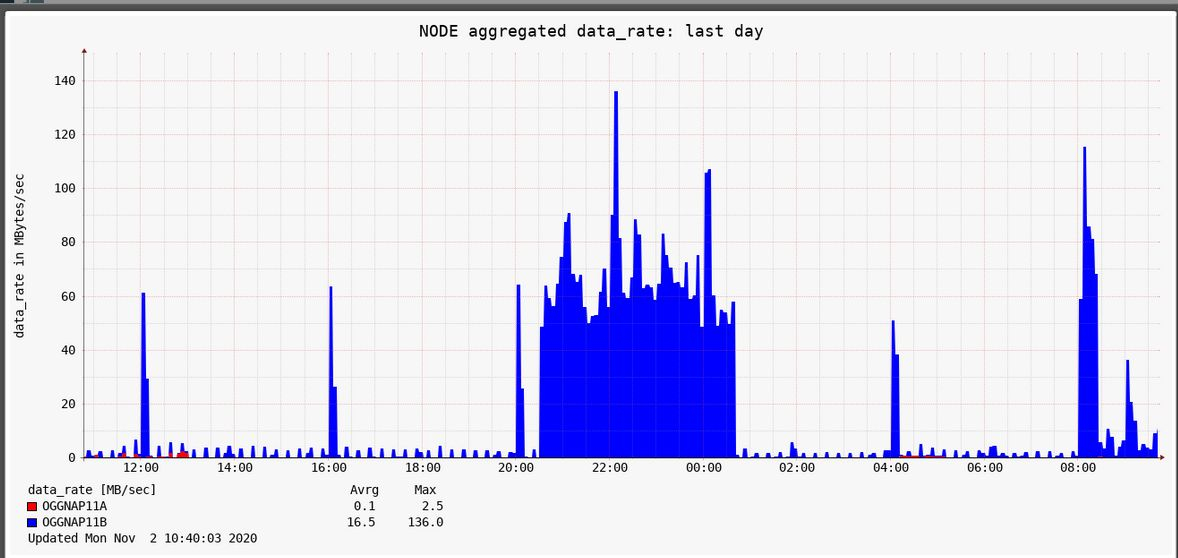
The overall data rates for nodes, SVMs, volumes and ports have to show nearly the same shape and also similar values, because the totals include all throughput. This is the case for the FAS 8200 but not for oggnap11! The node data rate shows another behaviour and also different values than data rates for SVMs, volumes and ports as can be seen in the attached screenshots.
There is also nearly no throughput for node A in the node data rate (except 6:30 and 10:00) wich doesn’t correspond to the port data rate.For comparison I also show a Grafana graph for the node throughput (last 24 hours) which corresponds to the STOR2RRD data rates for SVMs, volumes and ports but not to the node data rate. And in Grafana there is also throughput for node A.
 Grafana node throughput:
-
Hi,
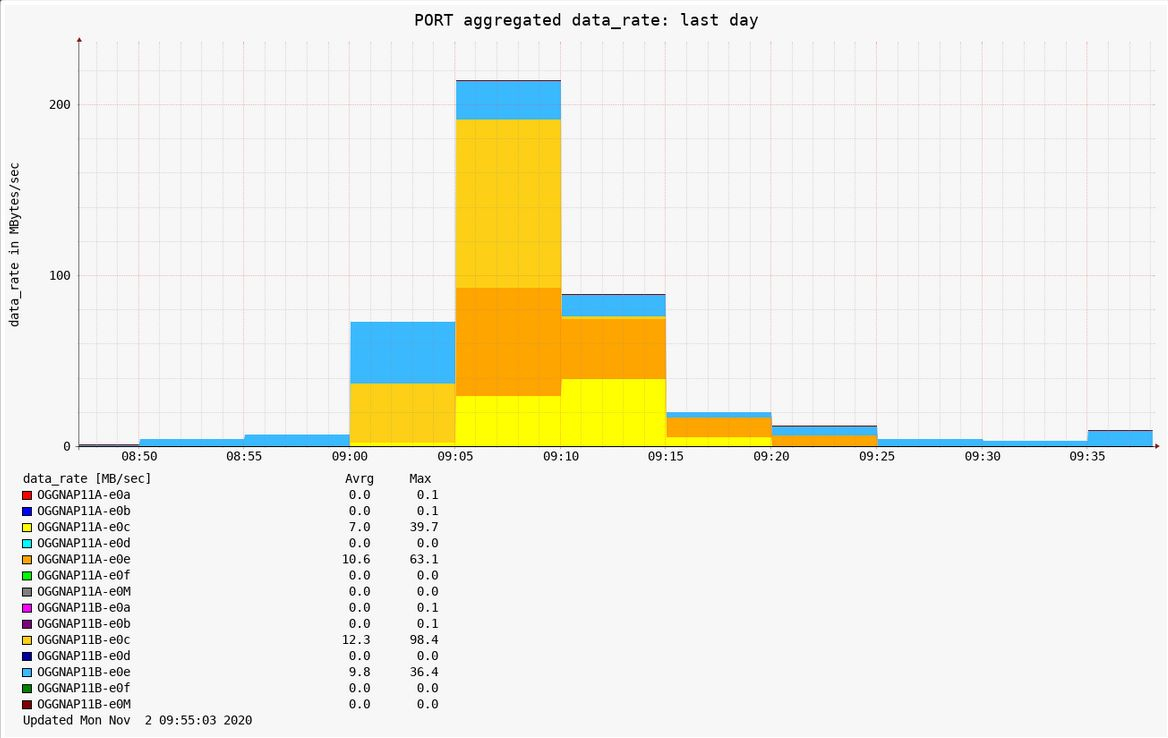
I’ve checked the data again, because it’s too bad that the graphs are not reliable for the FAS2750.
The port data correspond to the throughput data of Unified Manager after 9 am. But the node data again show nothing for node A, and also the values for node B are too low.
Unified Manager:
Node data STORR2RRD:
I’ve also collected data on oggnap11 with „statistics node show -interval 5 -iterations 0“, which show values for node A at 9:06 am (the data will be uploaded). But there are only values for 10 seconds. Is this time too short, so that the average will disappear? But why show the port data the correct results?
I’ve also collected dump files, which I will also upload.
Only in the cli.dump for 9:10 there is a small value for node A:
system:node::OGGNAP11A::total_data::122KB::-::-::Also the shape of the graphs are still different for the node data than for the other data (port, pool, …). The hourly peaks are not visible in the node data, but in the other data. The peaks can also be seen in Unified Manager or Grafana.

I’ve also checked naperf.pl from the new STOR2RRD 7.0, if there is some change. But there is only a small change for NFS4.
Regards,
Arndt


Howdy, Stranger!
Categories
- 1.7K All Categories
- 131 XorMon
- 26 XorMon Original
- 178 LPAR2RRD
- 14 VMware
- 20 IBM i
- 2 oVirt / RHV
- 5 MS Windows and Hyper-V
- Solaris / OracleVM
- 1 XenServer / Citrix
- Nutanix
- 8 Database
- 2 Cloud
- 10 Kubernetes / OpenShift / Docker
- 142 STOR2RRD
- 20 SAN
- 7 LAN
- 19 IBM
- 8 EMC
- 12 Hitachi
- 5 NetApp
- 17 HPE
- 1 Lenovo
- 1 Huawei
- 3 Dell
- Fujitsu
- 2 DataCore
- INFINIDAT
- 4 Pure Storage
- Oracle