Bug with graph scaling on standalone Windows server
Hello,

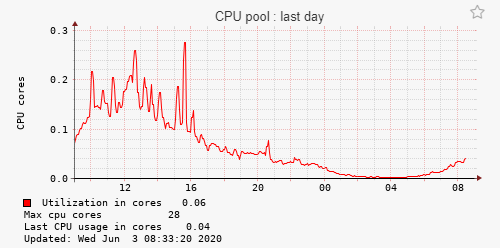
This server have 28 cores, and on this day it had over 80% utilization at 16h but graph shows 0.2 - 0.3 of something.
LPAR2RRD 6.16
Monitored server is Microsoft Windows Server 2012 R2 Standard.
Best Regards,

This server have 28 cores, and on this day it had over 80% utilization at 16h but graph shows 0.2 - 0.3 of something.
LPAR2RRD 6.16
- RRDTOOL version 1.4.8
- RRDp version 1.4008
LPAR2RRD-Win-agent-1.3.8Monitored server is Microsoft Windows Server 2012 R2 Standard.
Best Regards,
Comments
-
Hi,do you see that even on other (all) Win servers/VMs?
-
Hi,
Yes I see this problem on all Windows. But not on AIX / RHEL server or VMware graphs
Same server:
CPU from VMware:
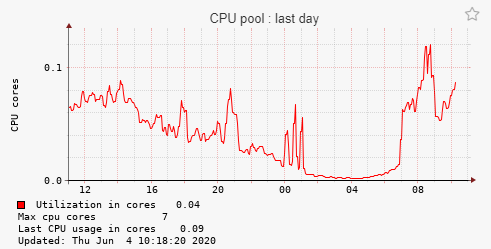
CPU from VMI - agent
(There are some other issues regrading Windows monitoring, but I will report them one by one to avoid confusion.)
Best Regards, -
Hi,are you sure it is the same server in both graphs?It should have 28 CPU (like in Vmware example and your initial example) but the last grapgh says 7.
-
Hi,
Yes I am sure. Server have 28 CPU but VMI - agent show only 7 in graph
Show from "Configuration" tab
View from VMware:
-
but there was 28 on the first screenshot you sent the day before actual screenshot.
-
Hi,
you are correct, but for some reason i have lost receiving info from this server:
So i have include different server but with same problem on witch i have full graph.
Sorry for confusion.
Howdy, Stranger!
Categories
- 1.7K All Categories
- 115 XorMon
- 26 XorMon Original
- 174 LPAR2RRD
- 14 VMware
- 20 IBM i
- 2 oVirt / RHV
- 5 MS Windows and Hyper-V
- Solaris / OracleVM
- 1 XenServer / Citrix
- Nutanix
- 8 Database
- 2 Cloud
- 10 Kubernetes / OpenShift / Docker
- 140 STOR2RRD
- 20 SAN
- 7 LAN
- 19 IBM
- 7 EMC
- 12 Hitachi
- 5 NetApp
- 17 HPE
- 1 Lenovo
- 1 Huawei
- 3 Dell
- Fujitsu
- 2 DataCore
- INFINIDAT
- 4 Pure Storage
- Oracle