100% Bad LPar CPU graph after running resource affinity process on Power8 server in HMC.

After running an affinity process for a power8 server from the HMC. The graph on the 3 lpar CPU tab was 100% incorrect.
I have restarted both HMC's (redundant HMCs managing the same servers) and the Lpar2rrd server but the metric is still 100% frozen on those 3 LPARs only).
What I think remains is to renicicate those LPar. But before, is there any other command to normalize Lpar2rrd server CPU metrics by HMC REST API?
The affected Lpar have dedicated cores, the other lpar with shared core there are no problems.
Lpar2rrd server version: 6.16
Lpar2rrd version AIX client: 6.15-2
HMC v9.1
Comments
-
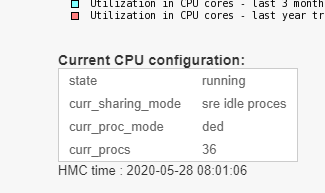
Hi,what is exact mode of that lpar, CPU dedicated, shared idle ..., screenshot ideal.has that hapened afetr you changed it to COU dedicated?I got no idea what affinity process is
-
Hi
I think the problem is that the lpars reports more idle_cycles than capped_cyles.
send us your logs to verify that.
cd /home/lpar2rrd/lpar2rrd;
tar cvhf logs.tar logs tmp data/*/*/iostat/*.json;
gzip -9 logs.tar;
Send us the logs.tar.gz via https://upload.lpar2rrd.com -
 Lpar have always been with core dedicated, the affinity process (Dynamic Platform Optimizer) serves to reorganize the allocation of cpu and memory to an lpar or vios.Ref. Dynamic Platform Optimizer (affinity cpu / ram process):https://www.ibm.com/support/knowledgecenter/TI0003M/p8hat/p8hat_abortdpo.htm
Note: logs.tar.gz already uploaded. -
ok, we have already seen it once.
Problem is that idle counter is bigger than capped on CPU dedicated
"processor" : {
"idleProcCycles" : 392909585077801644,
"mode" : "share_idle_procs",
"totalInstructionsExecutionTime" : 448132652086823331,
"utilizedUnCappedProcCycles" : 0,
"utilizedCappedProcCycles" : 356082298421712944,
"maxProcUnits" : 60,
"donatedProcCycles" : 0,
"maxVirtualProcessors" : 60,
"entitledProcCycles" : 356082298421712944,
"entitledProcUnits" : 36,
"timeSpentWaitingForDispatch" : 0,
"weight" : 0,
"totalInstructions" : 806317067655796769
},
356082298421712944, utilizedCappedProcCycles
392909585077801644, idleProcCycles
You cannot have more idle CPU cycles than capped one for a CPU dedicated lpar, it simply makes no sense.
I can just guess it might happen after any LPM? No idea, it is more about IBM to explain/fix.
LPAR reboot might fix it.
-
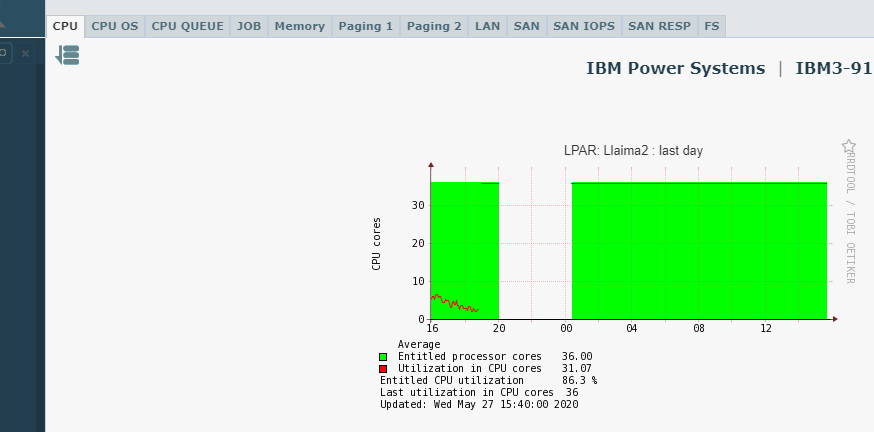
I have restarted the LPar and the problem persists. The CPU metric is still frozen at 100%. When reviewing the metrics directly on the web HMC they look correct (see screenshot). Will it be a problem with the API? Is IBM responsible for developing that API to see if I can open a case on IBM support?Thank you.

-
It is not an API problem, you can also see the difference of the counters at the command level (see attached). So I am going to open a case in IBM support in this regard I will inform you of news.

-
yep, HMC API provide wrong counters, let us know what IBM support says on that
-
IBM Support notes that there is a recently discovered flaw related to partition LPM and counts with dedicated processors. Its repair is already being worked on but there is no certainty when it is released.At the moment, the alternatives to correct the counters are:1.- The least impact and if it has the LPM capacity. You can migrate the non-active Lpar. Then Activate the destination server. Then (if you prefer) you can return it to the original server.2.- The most drastic ways would be to turn the server off and on, or to delete and recreate the partitions.I personally managed to solve it with option 1.thanks for everything.take care
-
thanks for info


Howdy, Stranger!
Categories
- 1.7K All Categories
- 131 XorMon
- 26 XorMon Original
- 178 LPAR2RRD
- 14 VMware
- 20 IBM i
- 2 oVirt / RHV
- 5 MS Windows and Hyper-V
- Solaris / OracleVM
- 1 XenServer / Citrix
- Nutanix
- 8 Database
- 2 Cloud
- 10 Kubernetes / OpenShift / Docker
- 142 STOR2RRD
- 20 SAN
- 7 LAN
- 19 IBM
- 8 EMC
- 12 Hitachi
- 5 NetApp
- 17 HPE
- 1 Lenovo
- 1 Huawei
- 3 Dell
- Fujitsu
- 2 DataCore
- INFINIDAT
- 4 Pure Storage
- Oracle