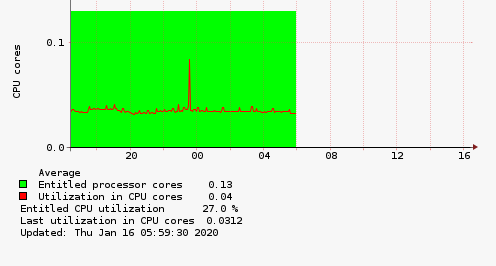
graph on server doesn't show latest timestamp
I monitor several IBM i systems, but one system (model 9009) does not show info till real time.
Time here is now 16:25, when I check the graph but graph only show info till 06:00-ish this morning.
What can I do to investigate more/and or provide you guys with the proper information to help me solve this?

Time here is now 16:25, when I check the graph but graph only show info till 06:00-ish this morning.
What can I do to investigate more/and or provide you guys with the proper information to help me solve this?

Comments
-
Hi,do you have proper time on the HMC?ssh hmc "date"If you use HMC CLI (ssh) access then assure lslparutil time is more less same as the HMc time in this outputsu - lpar2rrdcd /home/lpar2rrd/lpar2rrd./bin/sample_rate.sh
-
Thanks Pavel, you've pointed me in the right direction. We have two hmc's (both have correct times) but time and sample rate on for concerned server was NOK. I corrected this and all data for all server is nowup-to-date.
Howdy, Stranger!
Categories
- 1.7K All Categories
- 126 XorMon
- 26 XorMon Original
- 176 LPAR2RRD
- 14 VMware
- 20 IBM i
- 2 oVirt / RHV
- 5 MS Windows and Hyper-V
- Solaris / OracleVM
- 1 XenServer / Citrix
- Nutanix
- 8 Database
- 2 Cloud
- 10 Kubernetes / OpenShift / Docker
- 141 STOR2RRD
- 20 SAN
- 7 LAN
- 19 IBM
- 8 EMC
- 12 Hitachi
- 5 NetApp
- 17 HPE
- 1 Lenovo
- 1 Huawei
- 3 Dell
- Fujitsu
- 2 DataCore
- INFINIDAT
- 4 Pure Storage
- Oracle