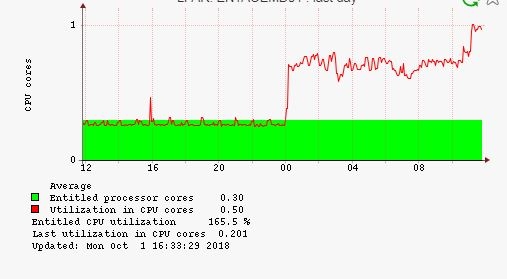
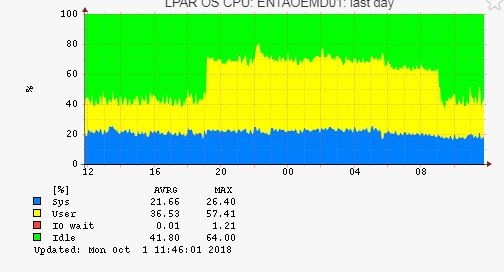
Mismatch between CPU tab and CPU OS tab.
Over the weekend, we had a situation where we had some Nagios processes fall into a runaway state and spike the CPU on a number of our AIX LPARs. LPAR2RRD captured this spike accurately on both the CPU and CPU OS tab. This morning we cleaned up those processes and the CPU utilization returned to normal (via vmstat, nmon, and topas outputs). When we looked at the LPAR2RRD graphs, the CPU OS (run from the agent) reflected the drop in utilization, but the CPU graph continues to show a high CPU utilization.
I checked the LPAR2RRD error.log and found nothing. I reran the load.sh and it completed without any errors or warnings in the data collection output, yet the CPU graph still reflects incorrect information.
Any ideas on how to correct this issue?
I checked the LPAR2RRD error.log and found nothing. I reran the load.sh and it completed without any errors or warnings in the data collection output, yet the CPU graph still reflects incorrect information.
Any ideas on how to correct this issue?
Comments
-
A further update. It appears that the OS tab graph returns to reporting correct information 5 hours after the issue was corrected.
-
Our sample rate is set to 60.
We did upgrade the HMCs to V9R1 M920 recently to prepare for eventual migration to IBM Power9 hardware. -
wrong time on the HMC.Check last update time, it is quite different in both examples.su - lpar2rrdcd /home/lpar2rrd/lpar2rrd./bin/sample_rate.shHMC time and lslprutil time must be more less same for that server.
-
HMC upgrade resets timezone often.Note: changing TZ require HMC reboot!
-
Pavel, you were correct. This version upgrade of the HMC did reset the TZ to UTC, the prior version did not.
-
It is interesting to note that the graph kept the local time settings. The update time showed the difference.
-
I know
 This is not definitelly only upgrade which resets TZ, we seen it many times in the past already.
 -
Time Zone changed and we will be checking to make sure that the graphs are now consistent. I found it interesting that the bottom line of the graph had the local time, but the graph line followed UTC.
-
both times should be same, both are from HMC.Send a screenshot example.
Howdy, Stranger!
Categories
- 1.7K All Categories
- 126 XorMon
- 26 XorMon Original
- 176 LPAR2RRD
- 14 VMware
- 20 IBM i
- 2 oVirt / RHV
- 5 MS Windows and Hyper-V
- Solaris / OracleVM
- 1 XenServer / Citrix
- Nutanix
- 8 Database
- 2 Cloud
- 10 Kubernetes / OpenShift / Docker
- 141 STOR2RRD
- 20 SAN
- 7 LAN
- 19 IBM
- 8 EMC
- 12 Hitachi
- 5 NetApp
- 17 HPE
- 1 Lenovo
- 1 Huawei
- 3 Dell
- Fujitsu
- 2 DataCore
- INFINIDAT
- 4 Pure Storage
- Oracle

