Missing 'SAN' plots during high I/O
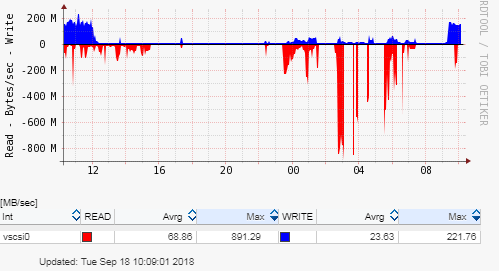
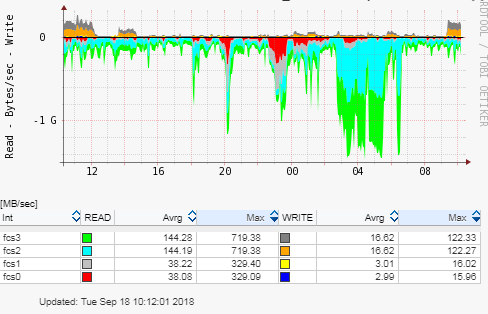
During times of high I/O on one of our LPARs, LPAR2RRD does not plot the data.
I've noticed that anytime I/O exceeds 1GBps, LPAR2RRD does not show the plots on the 'SAN' graph.
The 'SAN' graphs for the VIO partitions do show the I/O for the managed system approaching 1.6GBps but the LPAR 'SAN' graph just shows white space, as if there is no I/O occurring.
I've attached a couple if graphics to show what I am seeing. Has anyone else seen this behavior and know how to correct it?
Thanks!
-Mark


Comments
-
Hi,ok, let us check if that is something already fixed. I think I have already seen it ...What is your:lpar2rrd server version?lpar2rrd agent version?
Howdy, Stranger!
Categories
- 1.7K All Categories
- 115 XorMon
- 26 XorMon Original
- 174 LPAR2RRD
- 14 VMware
- 20 IBM i
- 2 oVirt / RHV
- 5 MS Windows and Hyper-V
- Solaris / OracleVM
- 1 XenServer / Citrix
- Nutanix
- 8 Database
- 2 Cloud
- 10 Kubernetes / OpenShift / Docker
- 140 STOR2RRD
- 20 SAN
- 7 LAN
- 19 IBM
- 7 EMC
- 12 Hitachi
- 5 NetApp
- 17 HPE
- 1 Lenovo
- 1 Huawei
- 3 Dell
- Fujitsu
- 2 DataCore
- INFINIDAT
- 4 Pure Storage
- Oracle