HPE StoreOnce rest api
We have:
"platformType": "HPE StoreOnce 5250",
"softwareVersion": "4.3.7-2345.50",
and stor2rrd v7.92
1. Total alerts - 262. So stor2rrd showing in "Health status" not recent events but first, starting 0.
/home/stor2rrd/stor2rrd/bin/storeonceperf_v4.pl
line 60 - get_alerts("https://$ip/rest/alerts");
Can you change to show alerts starting "last first"?
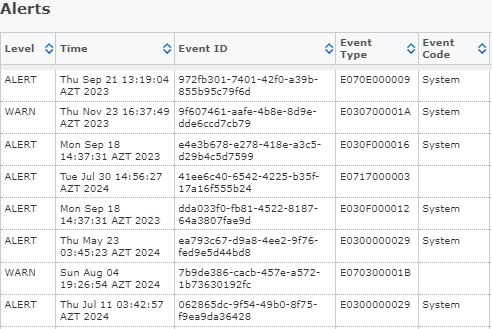
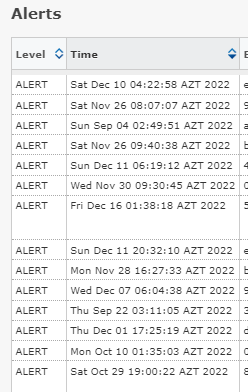
2. Time column in Alerts table sorting very strange, mixing years 2023 and 2024.
for example:
Can you fix this?
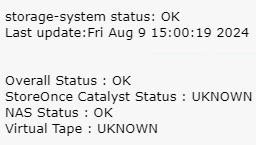
3. Overall Status looks like OK but our hardware NOT OK:
You getting information from
https://ip_address/api/v1/data-services/dashboard/appliance/{id}
"catStoresSummary": {
"statusSummary": {
"numOk": 0,
"numWarning": 0,
"numCritical": 0,
"numUnknown": 0,
"total": 0
}
BUT
"applianceStatus": "CRITICAL",
"applianceStatusString": "Critical",
.....
"hardwareStatus": "CRITICAL",
"hardwareStatusString": "Critical",
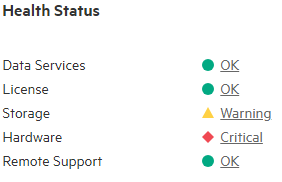
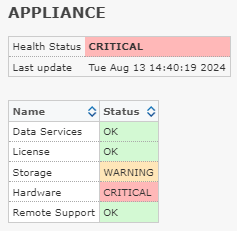
Is it possible to add hardware status in Health Status?
Comments
-
Hello GDen,
thank you for your insights, we'll take a look at it and make some changes.
We will let you know after the changes are made.
-
Hi GDen,
we have made some changes to Health Status page for Storeonce, can you apply this patch below to your stor2rrd instance?
After applying this patch wait about 10 minutes and check Health Status page and let us know if it looks better based on your insights.
https://download.stor2rrd.com/patch/7.92-14-g4ad7/storeonceperf_v4.pl.gz
Gunzip it and copy to /home/stor2rrd/stor2rrd/bin (755, stor2rrd owner)
-rwxrwxr-x 1 stor2rrd stor2rrd 89116 Aug 13 09:53 storeonceperf_v4.plIf your web browser gunzips it automatically then just rename it: mv storeonceperf_v4.pl.gz storeonceperf_v4.pl
Make sure the filesize is the same as in the example above
-
Hello.
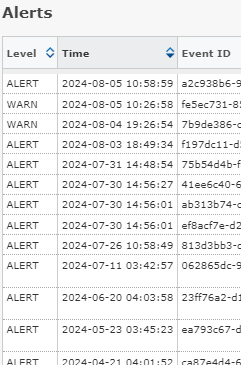
Yes, it's looks much better now:
But Alerts still old one:
-
Hello,
and do you have any new alerts also in the table or only these old alerts?
Just asking if the problem is in the sorting of the table or if old alerts are present.
We could for example filter alerts older than one month or something like that if this is the case.
Also if you can send us this html file just to check the alert sorting:
/home/stor2rrd/stor2rrd/www/<STOREONCE_APPLIANCE>/health_status.html
Thanks for the details.
-
"and do you have any new alerts also in the table or only these old alerts?" - only these old alerts.
I suppose that
get_alerts("https://$ip/rest/alerts");
shows first 100 alerts
<alertsEntries>
<count>100</count>
<total>260</total>
<unFilteredTotal>0</unFilteredTotal>
<start>0</start>
<prevPageUri>/rest/alerts?start=0&count=100&category=alerts</prevPageUri>
<nextPageUri>/rest/alerts?start=100&count=100&category=alerts</nextPageUri>
"Just asking if the problem is in the sorting of the table or if old alerts are present." - I think both.
"Also if you can send us this html file just to check the alert sorting:" - done
-
Hello,
thanks, one more patch. It should fix the sorting of alerts.
https://download.stor2rrd.com/patch/7.92-14-g4ad7/storeonceperf_v4.pl.gz
Gunzip it and copy to /home/stor2rrd/stor2rrd/bin (755, stor2rrd owner)
-rwxrwxr-x 1 stor2rrd stor2rrd 89577 Aug 13 14:28 storeonceperf_v4.plIf your web browser gunzips it automatically then just rename it: mv storeonceperf_v4.pl.gz storeonceperf_v4.pl
Make sure the filesize is the same as in the example above
-
Hello,
It looks just perfect now:
Thank you a lot!!! Really appreciate it!
Howdy, Stranger!
Categories
- 1.7K All Categories
- 126 XorMon
- 26 XorMon Original
- 176 LPAR2RRD
- 14 VMware
- 20 IBM i
- 2 oVirt / RHV
- 5 MS Windows and Hyper-V
- Solaris / OracleVM
- 1 XenServer / Citrix
- Nutanix
- 8 Database
- 2 Cloud
- 10 Kubernetes / OpenShift / Docker
- 141 STOR2RRD
- 20 SAN
- 7 LAN
- 19 IBM
- 8 EMC
- 12 Hitachi
- 5 NetApp
- 17 HPE
- 1 Lenovo
- 1 Huawei
- 3 Dell
- Fujitsu
- 2 DataCore
- INFINIDAT
- 4 Pure Storage
- Oracle
