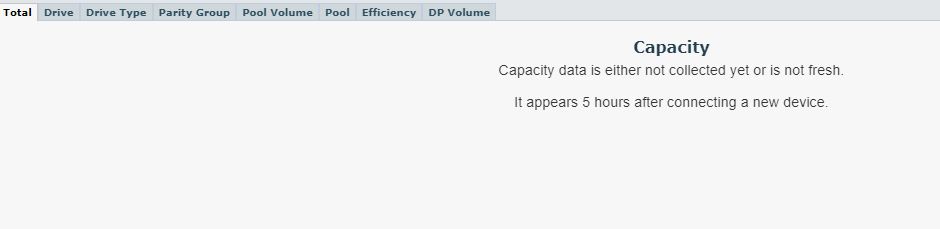
VSP 5600 Capacity tab without graphs

Hi Team,
I have added a VSP5600 as a new device, and after more than 5 hours no data is shown under capacity. I'm using the rigth export tool version.
Thanks in advance.
[lpar2rrd@xorux stor2rrd]$ sh /home/stor2rrd/stor2rrd/bin/config_check.sh HVSP5601
=========================
STORAGE: HVSP5601: VSPG
=========================
WARNING : TCP connection to "xx.xx.xx.xx" on port "1099" has failed! It might need to be open on the firewall.
TCP connection to "xx.xx.xx.xx" on port "51099" is ok
TCP connection to "xx.xx.xx.xx" on port "51100" is ok
WARNING : TCP connection to "xx.xx.xx.xx" on port "51101" has failed! It might need to be open on the firewall.
REST API TEST
TCP connection to "xx.xx.xx.xx" on port "443" is ok
/usr/bin/perl /home/stor2rrd/stor2rrd/bin/vspg_apitest.pl stor2rrd XXXXX 1.181.166 https HVSP5601 apitest
xx.xx.xx.xx
Machine Name: xxxxx.acme.com
Machine Type-Model: VSP 5600
Machine Serial: 5644456
IP address controller A:
IP address controller B:
Software Version: 90-09-23/00
Export tool version : 1
Loading ExportTool...
Export tool start [Version 90-09-23/00]
command file = /opt/hds/hds_test/command2.txt
[ 1] svpip xx.xx.xx.xx ; Specifies IP adress of SVP
[ 2] login User = [acme], Passwd = [****************]
[SVP Version] 90-09-23/00
[ExportTool version] 90-09-23/00
[ExportTool IF version] 90-00-00
[ 3] show ; output storing period
Monitoring time range
Short Range From : 2024/06/05 15:51 - To : 2024/06/10 15:51 Interval : 5min.
Long Range From : 2023/12/08 00:00 - To : 2024/06/10 15:30 Interval : 15min.
[ 4] group Port ; Port usage
[ 5] shortrange -0001:
shortrange [2024/06/10 15:46:00]:[2024/06/10 15:51:00], count = 1
[ 6] outpath "/opt/hds/hds_test/performance" ; specifies the sub-directory in which files will be saved
[ 7] option nocompress
[ 8] apply
Start gathering port data
Target = 32, Total = 32
+----+----+----+----+----+----+----+----+----+----+
...................................................
End gathering port data
Start gathering Initiator port data
Target = 8, Total = 8
+----+----+----+----+----+----+----+----+----+----+
...................................................
End gathering Initiator port data
Export tool end
connection ok
No SAN configured :
No LAN configured :
Comments
-
do you see it now?
Do you see at least data in performance graphs?
-
Hello Pavel.
Yes, I see data in performance graphs (cpu, node, pool, etc) but nothing under "Capacity"
Thanks.
-
send us logs
Note a short problem description in the text field of the upload form.
cd /home/stor2rrd/stor2rrd # or where is your STOR2RRD working dir
tar cvhf logs.tar logs tmp/*txt
gzip -9 logs.tar
Send us logs.tar.gz via https://upload.stor2rrd.com
-
Hi Pavel, already uploaded.
Ty.
-
Hello Pavel,
please let me now when you have been able to see it. Thanks.
-
we have already sent you an email few hours ago requesting more data

Howdy, Stranger!
Categories
- 1.7K All Categories
- 131 XorMon
- 26 XorMon Original
- 178 LPAR2RRD
- 14 VMware
- 20 IBM i
- 2 oVirt / RHV
- 5 MS Windows and Hyper-V
- Solaris / OracleVM
- 1 XenServer / Citrix
- Nutanix
- 8 Database
- 2 Cloud
- 10 Kubernetes / OpenShift / Docker
- 142 STOR2RRD
- 20 SAN
- 7 LAN
- 19 IBM
- 8 EMC
- 12 Hitachi
- 5 NetApp
- 17 HPE
- 1 Lenovo
- 1 Huawei
- 3 Dell
- Fujitsu
- 2 DataCore
- INFINIDAT
- 4 Pure Storage
- Oracle