SAN switch status problem
Hey,


Both switches use firmware v9.0.1b. SNMPv1 community is set with index number 4 and privileges set to READ. The ip address stor2rrd was added to the ACL and set to READ.
Do I have to do any additional configuration to get the correct status from the switches?
There is a limited number of open ports on the network where stor2rrd is located, could the lack of an open port 162 / udp be a problem?
Port 161 / udp is open.
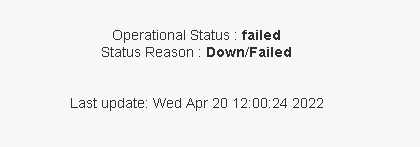
I have a problem with the health status of Brocade SAN switches, they are reachable by snmp, stor2rrd collects data, but in the Health Status -> Switch status tab they have operational status set to failed, while the reason status is set to Down / Failed.


Both switches use firmware v9.0.1b. SNMPv1 community is set with index number 4 and privileges set to READ. The ip address stor2rrd was added to the ACL and set to READ.
Do I have to do any additional configuration to get the correct status from the switches?
There is a limited number of open ports on the network where stor2rrd is located, could the lack of an open port 162 / udp be a problem?
Port 161 / udp is open.
Comments
-
Hi,
what returns this snmpwalk command?
snmpwalk -v 2c -c public <switch IP> 1.3.6.1.3.94.1.6.1.6
This is the same way as we use to collect health status information.
Here is an example from our lab:snmpwalk -v 2c -c public 192.168.1.1 1.3.6.1.3.94.1.6.1.6SNMPv2-SMI::experimental.94.1.6.1.6.16.0.0.5.30.144.73.231.0.0.0.0.0.0.0.0 = INTEGER: 3
-->
ok (3) - Healthy/okconnUnitStatus - 1.3.6.1.3.94.1.6.1.6Overall status of the connectivity unit. This switch status is based on the most severe status of contributors like Power supplies, Temperatures, Fans, WWN servers, Standby CP, Blades, Flash, Marginal ports, Faulty ports, Missing SFPs, and so on. switchStatusPolicyShow command displays the policy parameters that determines the overall switch status.Possible values are:• unknown (1) - Unknown• unused (2) - Unmonitored• ok (3) - Healthy/ok• warning (4) - Marginal/Warning• failed (5) - Down/Failed
The switch side shows this:brocade01:admin> switchstatusshowSwitch Health Report Report time: 04/20/2022 12:58:14 PMSwitch Name: brocade01IP address: 192.168.1.1SwitchState: HEALTHYDuration: 17784:43Power supplies monitor HEALTHYTemperatures monitor HEALTHYFans monitor HEALTHYFlash monitor HEALTHYMarginal ports monitor HEALTHYFaulty ports monitor HEALTHYMissing SFPs monitor HEALTHYFabric Watch is not licensedDetailed port information is not included -
Hi,
snmpwalk returned:
snmpwalk -v 2c -c <community> <ip-address> 1.3.6.1.3.94.1.6.1.6SNMPv2-SMI::experimental.94.1.6.1.6.16.0.216.31.204.186.201.244.0.0.0.0.0.0.0.0 = INTEGER: 5
On the server side, the switchstatusshow command does not work, but I used switchshow which returned:switchName: <Switch Name>switchType: 181.0switchState: OnlineswitchMode: NativeswitchRole: PrincipalswitchDomain: 1switchId: <Switch ID>switchWwn: <Switch WWN>zoning: ON (<Zone>)switchBeacon: OFFFC Router: OFFFabric Name: Fab_AHIF Mode: OFFAllow XISL Use: OFFLS Attributes: [FID: 128, Base Switch: No, Default Switch: Yes, Ficon Switch: No, Address Mode 0]
I have replaced some information with entries in <> and omitted the port information.
Currently, FOS v9.0.1b is installed on the switches. -
Hi,
does this command work on your switch?brocade01:admin> switchstatuspolicyshowThe current overall switch status policy parameters:Down Marginal----------------------------------PowerSupplies 2 1Temperatures 2 1Fans 2 1Flash 0 1MarginalPorts 2 1FaultyPorts 2 1MissingSFPs 0 0 -
Hi
I have same problem on 2 of my switches.
They both are HPE SN6500B 16GB 96/96 (other switches differ)
Both has v8.2.2c (there are other switches in fabric with same versions but without failure status)
Both has *BAD_FAN (CRITICAL) in mapsdb --show, butfanshowFan 1 is Ok, speed is 2035 RPMFan 2 is Ok, speed is 2023 RPMFan 3 is Ok, speed is 2011 RPMFan 4 is Ok, speed is 12001 RPMFan 5 is Ok, speed is 11969 RPM
switchstatusshow or switchstatuspolicyshow doesn't work -
HPE support adviced to do hareboot and it helped.
mapsdb --show now show2 Switch Health Report:=======================Current Switch Policy Status: HEALTHY
And status in stor2rrd is OK as well as snmpwalksnmpwalk -v 2c -c public <ip> 1.3.6.1.3.94.1.6.1.6iso.3.6.1.3.94.1.6.1.6.16.0.136.148.113.64.127.199.0.0.0.0.0.0.0.0 = INTEGER: 3
Howdy, Stranger!
Categories
- 1.7K All Categories
- 126 XorMon
- 26 XorMon Original
- 176 LPAR2RRD
- 14 VMware
- 20 IBM i
- 2 oVirt / RHV
- 5 MS Windows and Hyper-V
- Solaris / OracleVM
- 1 XenServer / Citrix
- Nutanix
- 8 Database
- 2 Cloud
- 10 Kubernetes / OpenShift / Docker
- 141 STOR2RRD
- 20 SAN
- 7 LAN
- 19 IBM
- 8 EMC
- 12 Hitachi
- 5 NetApp
- 17 HPE
- 1 Lenovo
- 1 Huawei
- 3 Dell
- Fujitsu
- 2 DataCore
- INFINIDAT
- 4 Pure Storage
- Oracle