Link failures per minute
Hello 
I have access to a stor2rrd board. What a wonderful tool!
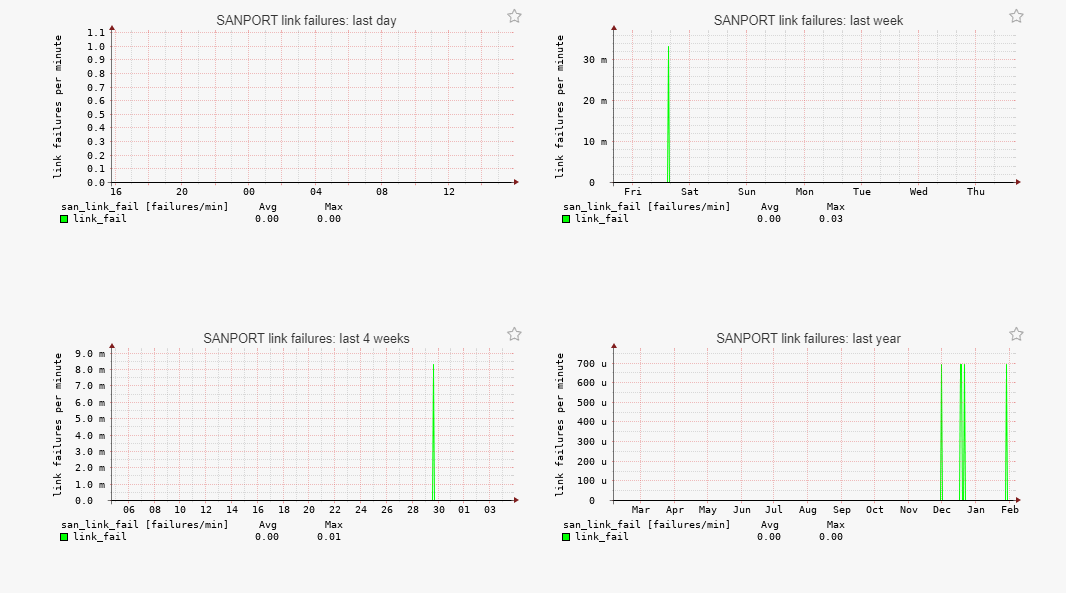
But I have a graph that I don't understand. If I choose a port on my Cisco MDS and choose the "Link fail" tab - what is on the y-axis?
I see some peaks - but I don't understand what's on the y-aksis?
last day: no units
last week: the unit is m
last 4 weeks: the unit is m
last year: the unit is u
I am a little confused ;-)
PS: Anyone who knows if I shall do anything with those peaks?

Comments
-
Hi,"m" == miliIn your case, weekly grah is peak about 0.03 per/secondsIt means there was 2 failures in a minute (60 * 0.03 =~ 2)
-
"u" seems to be micro
-
And what about the "u"
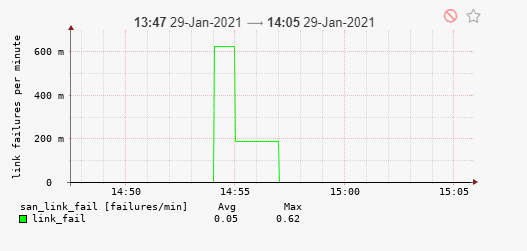
If I zoom in to the graph I see this - which mean I had 600.000 link failures per minute?
-
no 0,6 failures per second60*0.6=36 failures in a minute 14:54
-
Thank you Pavel - I
 your tool!
Howdy, Stranger!
Categories
- 1.7K All Categories
- 115 XorMon
- 26 XorMon Original
- 174 LPAR2RRD
- 14 VMware
- 20 IBM i
- 2 oVirt / RHV
- 5 MS Windows and Hyper-V
- Solaris / OracleVM
- 1 XenServer / Citrix
- Nutanix
- 8 Database
- 2 Cloud
- 10 Kubernetes / OpenShift / Docker
- 140 STOR2RRD
- 20 SAN
- 7 LAN
- 19 IBM
- 7 EMC
- 12 Hitachi
- 5 NetApp
- 17 HPE
- 1 Lenovo
- 1 Huawei
- 3 Dell
- Fujitsu
- 2 DataCore
- INFINIDAT
- 4 Pure Storage
- Oracle
