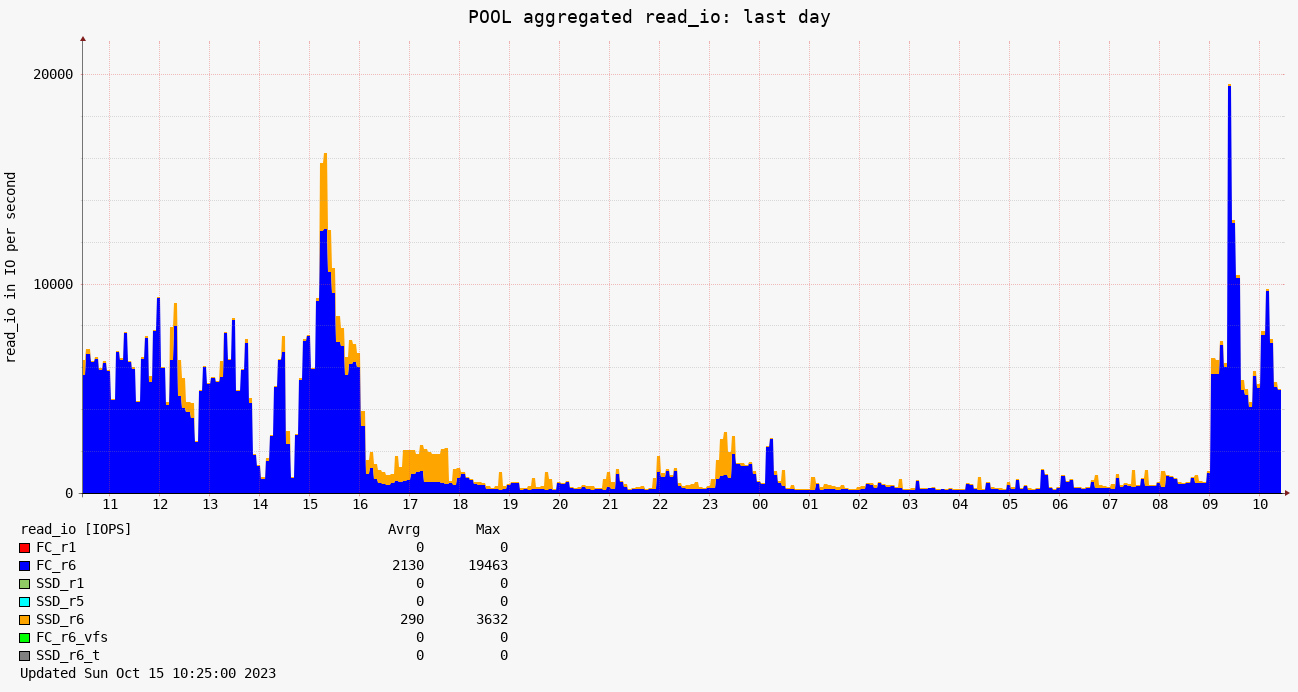
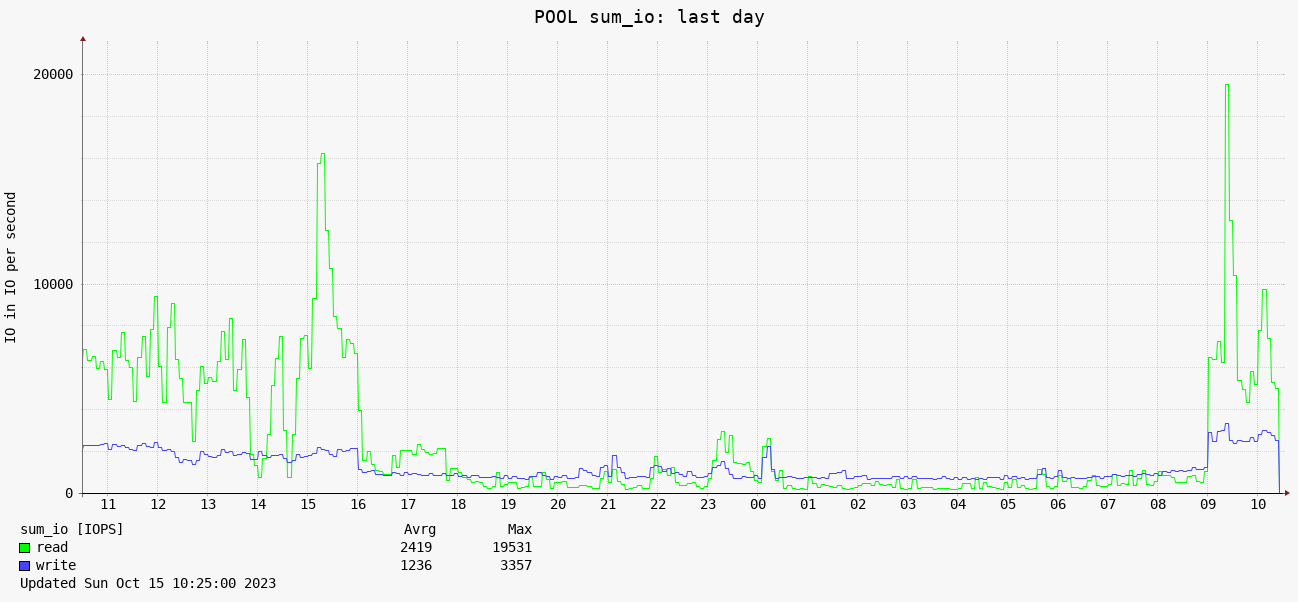
change from area chart to graph line

Comments
-
it is hardcoded, no way to change it by a user
-
if we get the support from your side by buying it can you change the chart?
-
you request to change all our philosophy how to present data in graphs, there is hundreds of similar graphs, it is noting we will change even if you purchase support (I mean even like custom change just for you)
I believe it is something what majority of users like on our product, something what make sence from our point.
if you do not like it then try other product(s) where you might find it.

Howdy, Stranger!
Categories
- 1.5K All Categories
- 7 XORMON NG
- 24 XORMON
- 123 LPAR2RRD
- 9 VMware
- 12 IBM i
- 1 oVirt / RHV
- 4 MS Windows and Hyper-V
- Solaris / OracleVM
- XenServer / Citrix
- Nutanix
- 6 Database
- 1 Cloud
- 9 Kubernetes / OpenShift / Docker
- 102 STOR2RRD
- 14 SAN
- 6 LAN
- 15 IBM
- 3 EMC
- 10 Hitachi
- 5 NetApp
- 13 HPE
- Lenovo
- 1 Huawei
- 1 Dell
- Fujitsu
- 2 DataCore
- INFINIDAT
- 3 Pure Storage
- Oracle