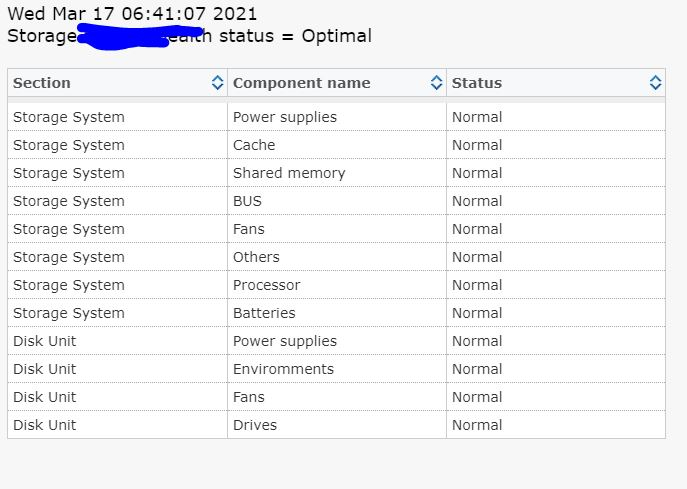
Logs for Health Status?

Hi,
since while i can see my systems are red. But i cant found a reason. Which logs do i have to colsult about that? All datas is see are looking good. But Health wont turn green. No changes if i chenge between Rest-API and the other.
since while i can see my systems are red. But i cant found a reason. Which logs do i have to colsult about that? All datas is see are looking good. But Health wont turn green. No changes if i chenge between Rest-API and the other.
=========================
STORAGE: **********: VSPG
=========================
  TCP connection to "******" on port "1099" is ok
  TCP connection to "******" on port "51099" is ok
  TCP connection to "******" on port "51100" is ok
  WARNING : TCP connection to "******" on port "51101" has failed! It might need to be open on the firewall.
  REST API TEST

  TCP connection to "******" on port "443" is ok
/usr/bin/perl /home/stor2rrd/stor2rrd/bin/vspg_apitest.pl stor2rrd XXXXX ****** https System02 apitest ******


  Machine Name: *******-G1500

  Machine Type-Model: VSP G1000

  Machine Serial: ******

  IP address controller A:

  IP address controller B:

  Software Version: 80-06-82/00

Export tool version : 1
Loading ExportTool...
Export tool start [Version 80-06-78/00]
command file = /opt/hds/hds_test/command2.txt
[  1] svpip ******        ; Specifies IP adress of SVP
[  2] login User = [*********], Passwd = [SP5SP5****]
[SVP Version] 80-06-78/00
[ExportTool version] 80-06-78/00
[ExportTool IF version] 80-00-00
[  3] show                  ; output storing period
Monitoring time range
Short Range From : 2021/03/12 05:30 - To : 2021/03/17 05:30 Interval : 5min.
Long  Range From : 2020/09/13 00:00 - To : 2021/03/17 05:15 Interval : 15min.
[  4] group Port ; Port usage
[  5] shortrange -0001:
        shortrange [2021/03/17 05:25:00]:[2021/03/17 05:30:00], count = 1
[  6] outpath "/opt/*******/hds_test/performance"  ; specifies the sub-directory in which files will be saved
[  7] option nocompress
[  8] apply
Start gathering port data
Target = 54, Total = 54
+----+----+----+----+----+----+----+----+----+----+
...................................................
End gathering port data
Start gathering Initiator port data
Target = 10, Total = 10
+----+----+----+----+----+----+----+----+----+----+
...................................................
End gathering Initiator port data
Export tool end
  connection ok
Comments
-
Hello,
It looks problem with CCI interface. We added a check if the CCI interface works.
New tab CCI (near health status) Do you see a new tab?Let us know.
Thank you
-
Hi,
yes, i see the some problem but not the source of that.
As an example.
"CCI configuration is NOK. The last successful configuration was performed Thu Jul 16 03:56:22 2020"
System was green. I don't know exactly when the graphic turned red. However, CCI with "check...." seem to be completely OK.
-
Hello,
hm. Example above (see REST API interface). This has nothing to do with the CCI interface. Do you see the new CCI tab for storage that uses the REST API?
Thank you
-
Yes. I reconfigured to CLI and see CLI Tab with NOK
Question: Is it possible to disable SNMP/HealthCheck complete? If i empty the SNMP Part the check.sh script request Health Check and say "Not OK". I like to disabled it complete, if possible., -
Hello,
Can I know your reason? Annoying announcements? Red color of the health status (storage)?
Thank you
-
In my second environment ist 161 blocked. 2 systems hard restricted network.
I got a new "problem". After my test with cloning a device i see in the "Health" page a System***cloned. That was i name i used, thats OK. But the device ist deleted, its not more there. But on the healthPage its gray and listet. No folders left and i dont no where to delete.
Regards
-
about a new problem:
cd /home/stor2rrd/stor2rrd # or where is your STOR2RRD working dir
rm tmp/health_status_summary/<STORAGE ALIAS>*refresh GUI.now it should be fine
thank you
-
 Thanks

Howdy, Stranger!
Categories
- 1.7K All Categories
- 131 XorMon
- 26 XorMon Original
- 178 LPAR2RRD
- 14 VMware
- 20 IBM i
- 2 oVirt / RHV
- 5 MS Windows and Hyper-V
- Solaris / OracleVM
- 1 XenServer / Citrix
- Nutanix
- 8 Database
- 2 Cloud
- 10 Kubernetes / OpenShift / Docker
- 142 STOR2RRD
- 20 SAN
- 7 LAN
- 19 IBM
- 8 EMC
- 12 Hitachi
- 5 NetApp
- 17 HPE
- 1 Lenovo
- 1 Huawei
- 3 Dell
- Fujitsu
- 2 DataCore
- INFINIDAT
- 4 Pure Storage
- Oracle