Graphs in Custom group - wrong scale
Hi,
i test arround with this tool. I setup a custom group for my DWDM and the data on the ports itself shown correct.
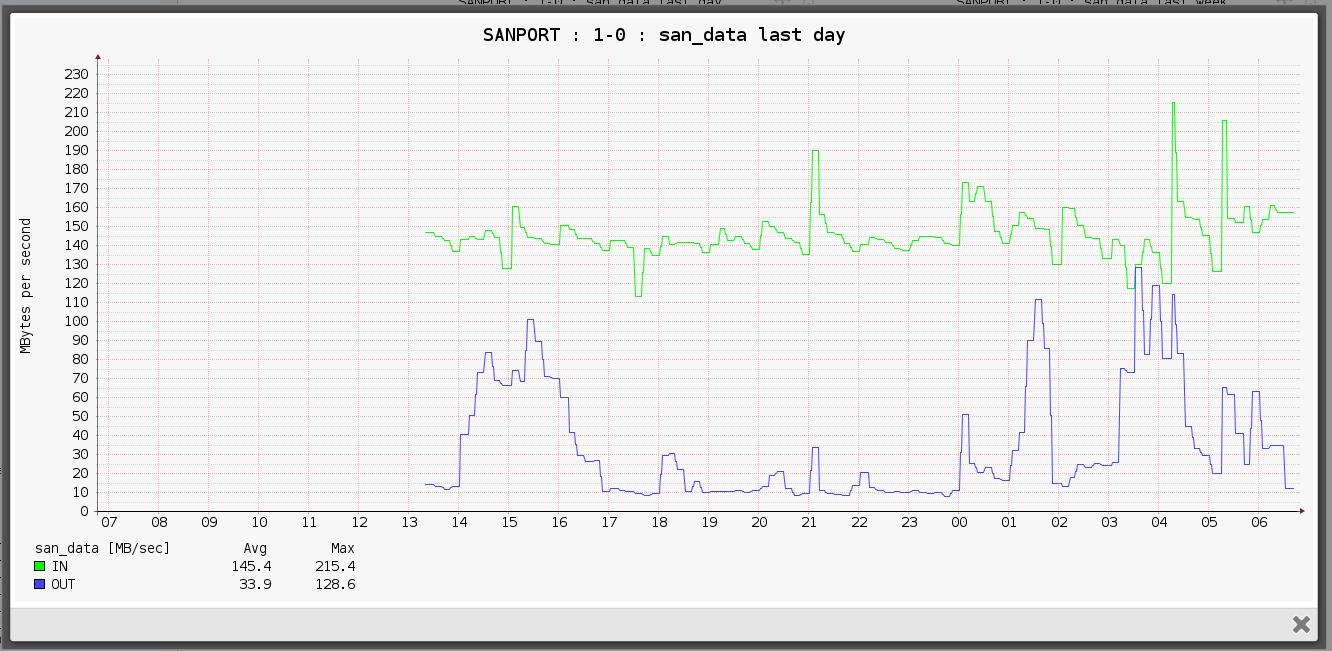
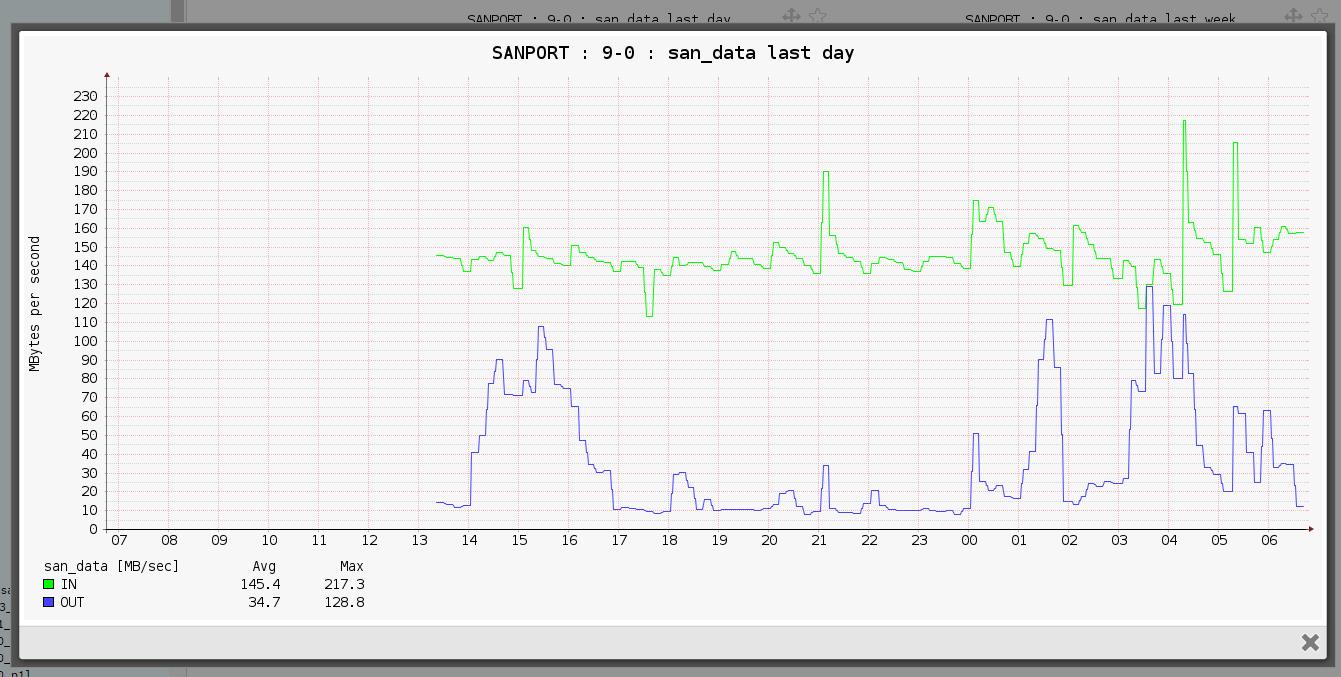
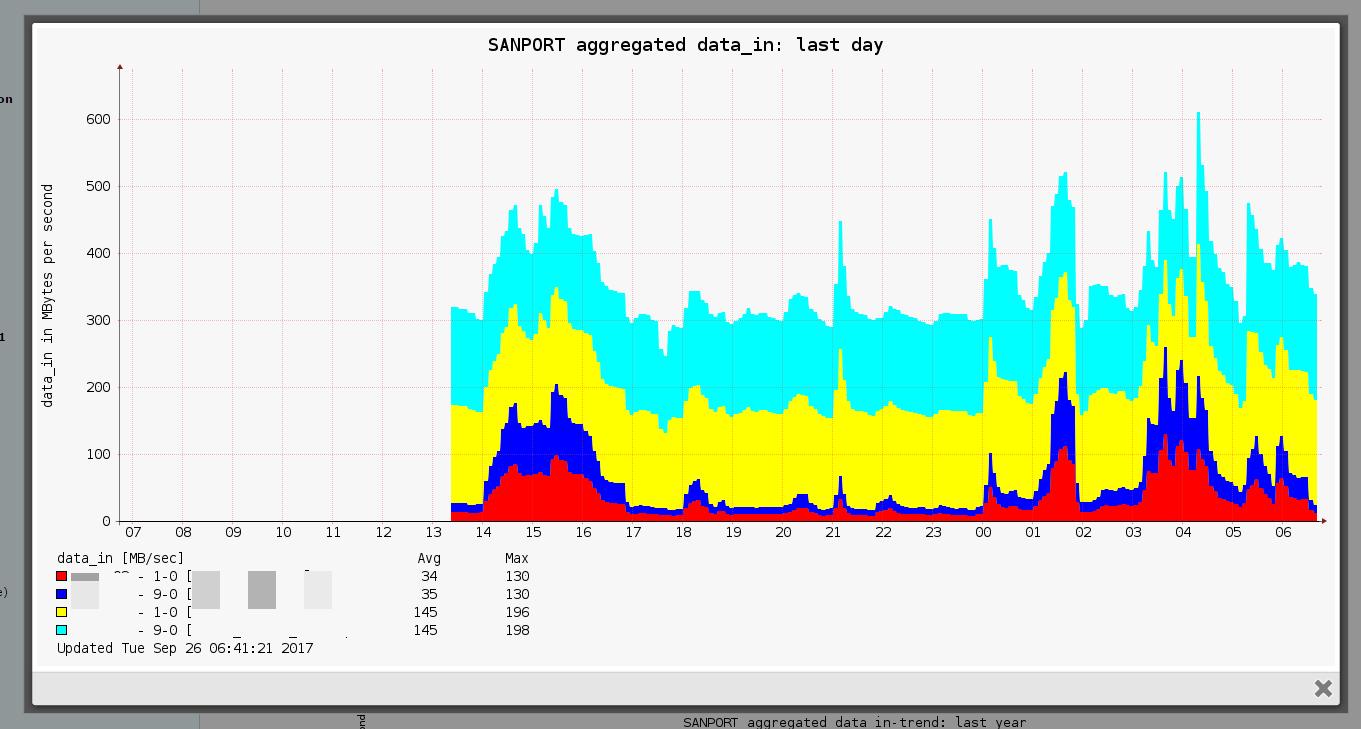
But in the custom group i see 2 ports up to 400Mb/s what they never reach - as you can see in the "max" and "average" table below. 2of them are shown correct (blue and red). I try yesterday to delete alle datas, but that dosent solve that problem. Its onyl seen in custom groups.


Comments
-
custom group graph is aggregated, it means that all traffic from all selected ports is cumulated (stacked).
I thing it is ok from your screenshots.
-
OK. Thanks
Howdy, Stranger!
Categories
- 1.7K All Categories
- 126 XorMon
- 26 XorMon Original
- 176 LPAR2RRD
- 14 VMware
- 20 IBM i
- 2 oVirt / RHV
- 5 MS Windows and Hyper-V
- Solaris / OracleVM
- 1 XenServer / Citrix
- Nutanix
- 8 Database
- 2 Cloud
- 10 Kubernetes / OpenShift / Docker
- 141 STOR2RRD
- 20 SAN
- 7 LAN
- 19 IBM
- 8 EMC
- 12 Hitachi
- 5 NetApp
- 17 HPE
- 1 Lenovo
- 1 Huawei
- 3 Dell
- Fujitsu
- 2 DataCore
- INFINIDAT
- 4 Pure Storage
- Oracle