missing OS Agent data in Xormon NG 1.8

We're starting our rollout of Xormon NG and in our testing so far, the OS agent stats are not showing up for the select systems that we've added. The only OS data showing up is filesystem related (space utilization, multipath, etc). None of the CPU, job, memory, paging, SAN, LAN stats show up.
Agents are version 8.0 and have been installed and running for 24 hours, so it's not an early data collection issue.
Any guidance on how to fix this? We have a number of key systems that need that OS agent data for us to cut over to NG from the old lpar2rrd.
Thanks,
Comments
-
Sorry, forgot to mention that these are AIX systems, not Linux. AIX version is 7.2 TL5
-
make sure you use XorMon NG 1.8.0 (it was released recently)
if, so, send us logs and some screenshot to document there is no OS agent graphs for some LPAR
UI --> settings --> Logs --> support logs: follow the form
Send us generated file via https://upload.xormon.com
Note a reference pls.
-
uploaded under my email account. Thanks Pavel.
-
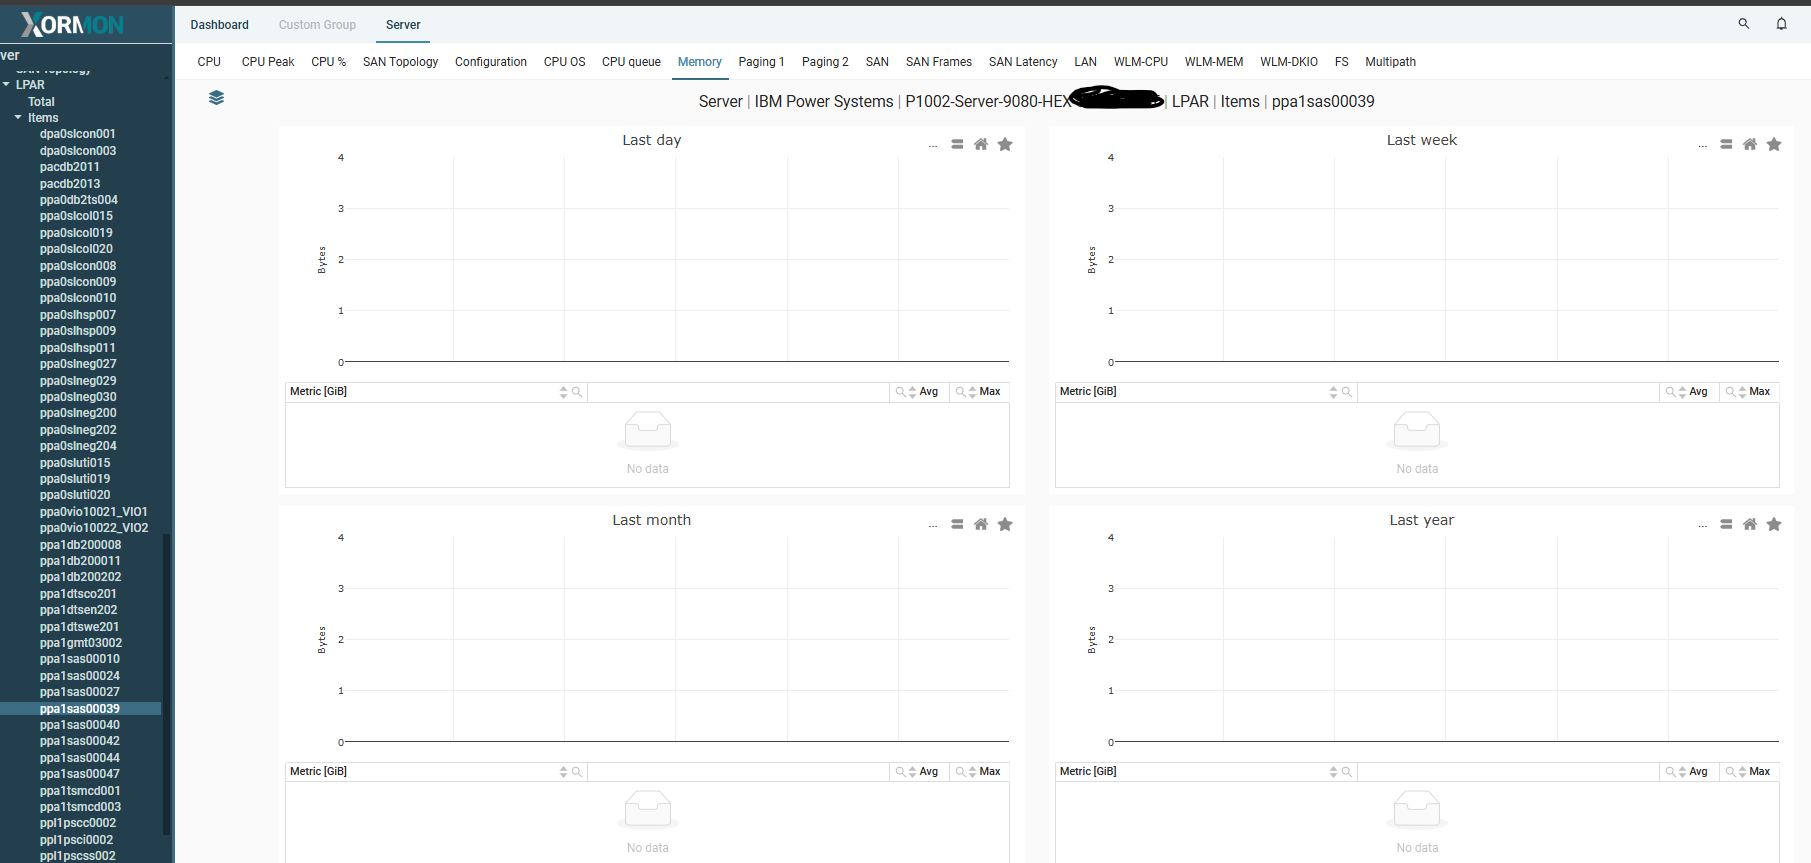
Hi! We are having the same exact issue here. Some help would be appreciated. We are using lpar2rrd without issues and we are also trying Xormon. But No OS Agent graphs are being displayed for all LPARs. All agent tabs look like this (HMC related data works fine, though) :
We are using Xormon 1.8 and all agents were updated to 8.0. But we tried Xormon a few months ago and the same behavior was happening.
I also uploaded the logs under my e-mail account.
Best Regards,
Sergio.
-
This is blocking our migration to xormon-ng, any assistance would be appreciated.
Thanks


Howdy, Stranger!
Categories
- 1.7K All Categories
- 131 XorMon
- 26 XorMon Original
- 178 LPAR2RRD
- 14 VMware
- 20 IBM i
- 2 oVirt / RHV
- 5 MS Windows and Hyper-V
- Solaris / OracleVM
- 1 XenServer / Citrix
- Nutanix
- 8 Database
- 2 Cloud
- 10 Kubernetes / OpenShift / Docker
- 142 STOR2RRD
- 20 SAN
- 7 LAN
- 19 IBM
- 8 EMC
- 12 Hitachi
- 5 NetApp
- 17 HPE
- 1 Lenovo
- 1 Huawei
- 3 Dell
- Fujitsu
- 2 DataCore
- INFINIDAT
- 4 Pure Storage
- Oracle