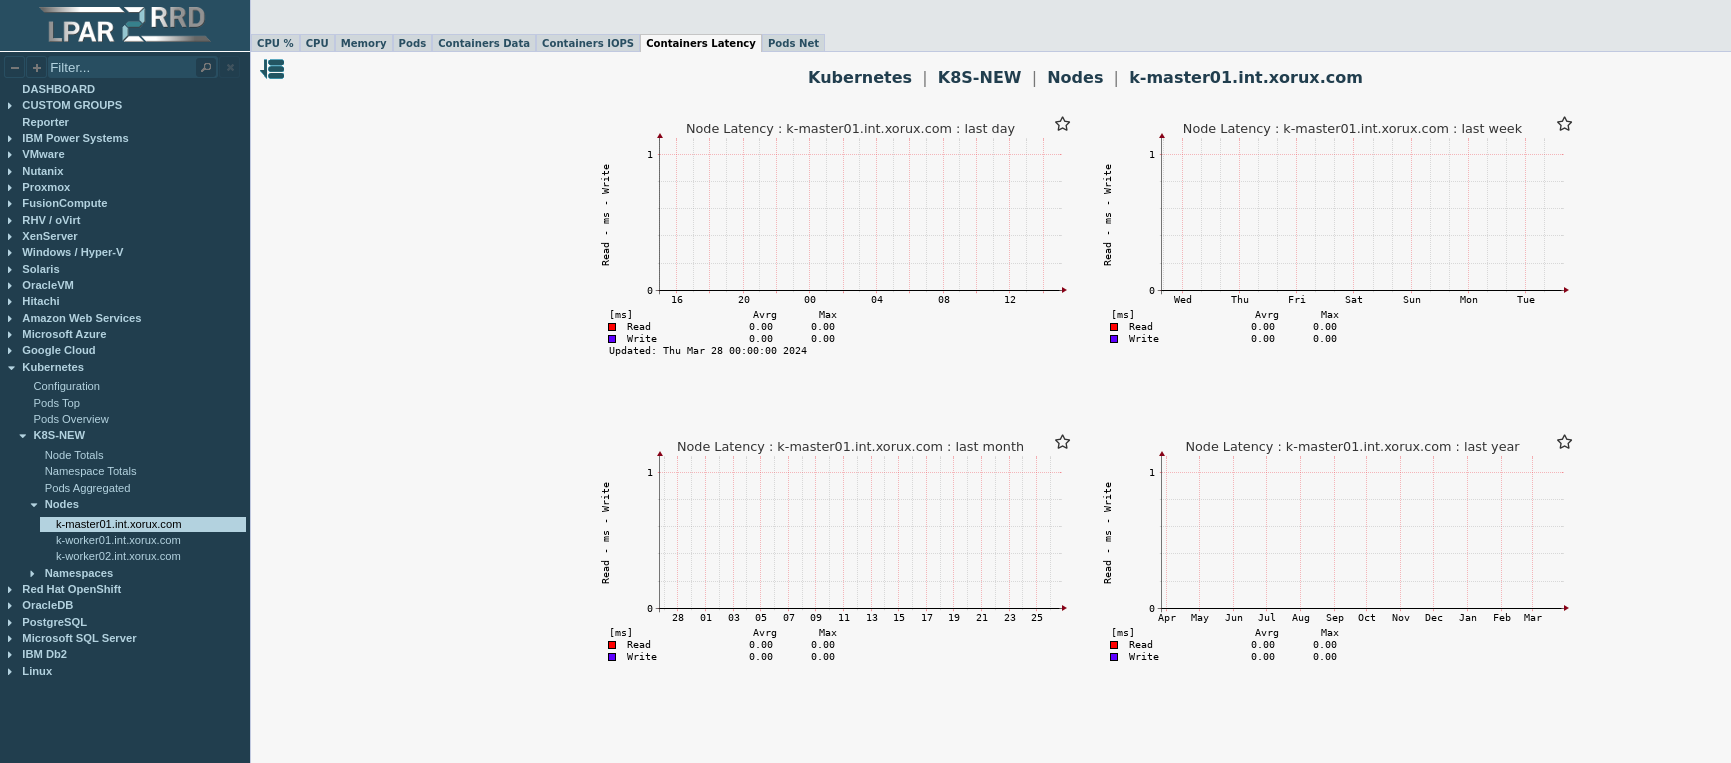
Latency
Hello team,
Is there any reason why in kubernetes charts for latency (node/pods...) are empty? - the same case is visible in your demo.
How to get latency charts for kubernetes?
thanks
Comments
-
Anyone?
-
Hi,
please send the logs:
cd /home/lpar2rrd/lpar2rrd # or your LPAR2RRD working dir
tar cvhf logs.tar logs tmp/*txt tmp/*json
gzip -9 logs.tar
Send us logs.tar.gz via https://upload.lpar2rrd.com
-
OK, I will provide logs soon, but as I wrote - the same case is in your Demo - https://demo.lpar2rrd.com/?menu=2817960&tab=6 -> Containers Latency tab.
-
Any findings? logs were uploaded March 25.
-
we will provide you a fix this week.
-
OK, thx.
-
Any update?
-
Any update?
-
Hi,
we are collecting
'container_fs_io_time_seconds_total'from cadvisror. Description:"Cumulative count of seconds spent doing I/Os".We ran some IO workloads in containers and compared node sysstat data with cadvisor. It seems
'container_fs_io_time_seconds_total'is in nanoseconds rather than seconds.Fix is almost ready, we are testing it right now.
-
how is testing going?
-
IS the fix included in 7.90 release?
-
no, data provided by the kubernetes API is weird, or better, it is wrong as per us, it would have to be fixed on the kubernetes side
-
OK, but is there any action plan? current charts are unfortunately useless.
-
we know, but we do not know what to do, problem is not on our side, i.e. no any action plan
Howdy, Stranger!
Categories
- 1.7K All Categories
- 126 XorMon
- 26 XorMon Original
- 176 LPAR2RRD
- 14 VMware
- 20 IBM i
- 2 oVirt / RHV
- 5 MS Windows and Hyper-V
- Solaris / OracleVM
- 1 XenServer / Citrix
- Nutanix
- 8 Database
- 2 Cloud
- 10 Kubernetes / OpenShift / Docker
- 141 STOR2RRD
- 20 SAN
- 7 LAN
- 19 IBM
- 8 EMC
- 12 Hitachi
- 5 NetApp
- 17 HPE
- 1 Lenovo
- 1 Huawei
- 3 Dell
- Fujitsu
- 2 DataCore
- INFINIDAT
- 4 Pure Storage
- Oracle
