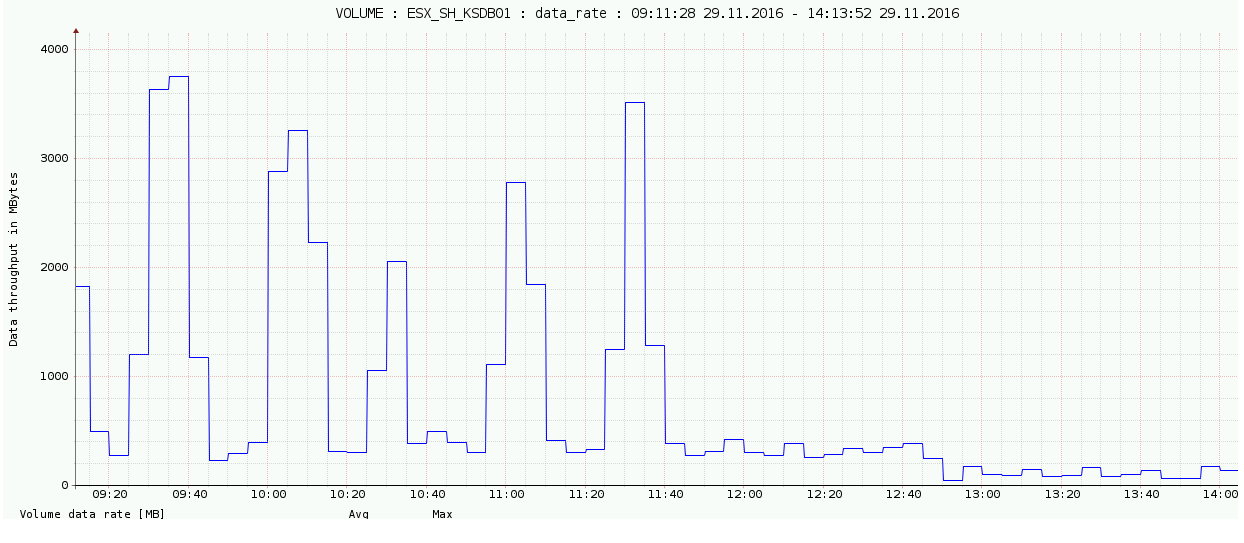
wrong bandwidth information
Comments
-
Hi,
1. What storage type is it?
2. How do you meassure it on VMware side via nmon? As throughput per filesystem? What says througput per adapter?
3. Do you have SAN monitoring? What do you see on ports? Well traffic can be shared I know, just asking if there is not dedicated SAN.
There can be some explanations behind, for example if you request small blocks then storage might provide 4kB block but it is about quite deep debuging and understanding of all data stack include SAN.
I think that the best way how to prove it is make a test like this:
time dd if=/dev/zero of=/filesystem_on_test_volume/test_file bs=4k count=1000000
Set count high enought to let it run for 15 - 20 minutes at least.
Then count throughput locally from elapsed time and number of MB transfered and compare it from storage view via STOR2RRD GUI.
It is one of method how we testing if we present reliable data.
-
1. 3par 8450, all flash
2.On VMware side we used different methods. Including vcenter performance statistic/ All of them show same numbers.
3. Tried dd. With small load all seems ok. But with high load...
As an example the host on this screenshot has only four 8gb ports. It's AIX host on power8 system. It can't be 4200 Mb/s, it just doesn't have enough ports throughput.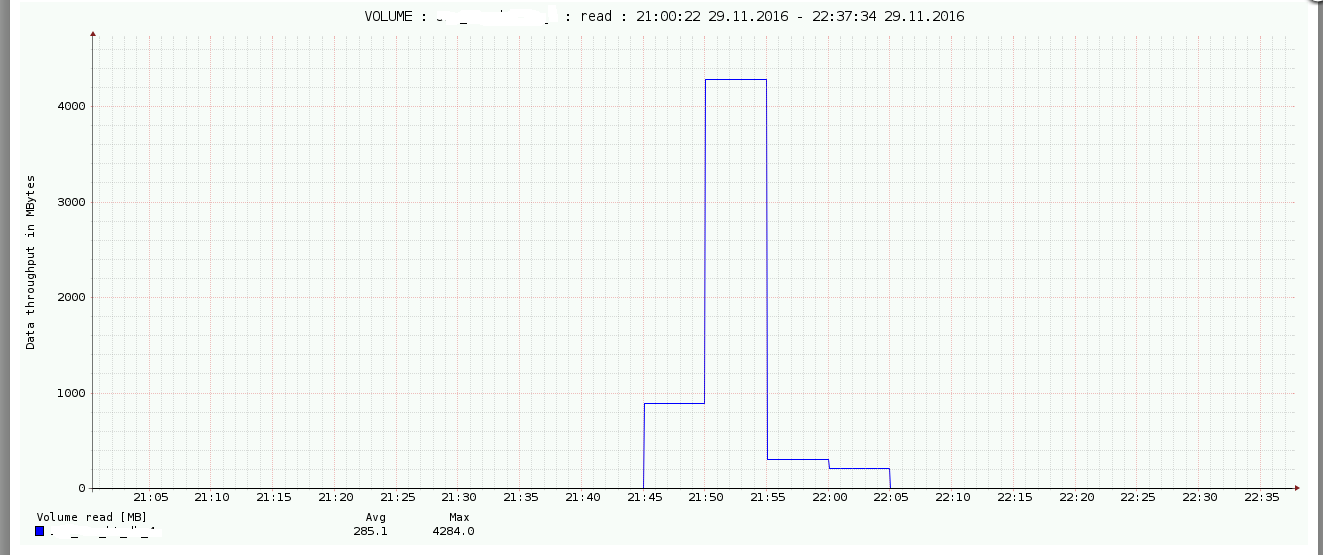 lsdev -cadapter | grep fcsfcs0 Available 02-00 8Gb PCI Express Dual Port FC Adapter (df1000f114108a03)fcs1 Available 02-01 8Gb PCI Express Dual Port FC Adapter (df1000f114108a03)fcs2 Available 01-00 8Gb PCI Express Dual Port FC Adapter (df1000f114108a03)fcs3 Available 01-01 8Gb PCI Express Dual Port FC Adapter (df1000f114108a03
 -
Do you see IOPS in VMware/AIX? Are they comparable?
Basically we present only what storage provides. If it works fine for smaller data loads then it does not look like for any problem in stor2rrd.
What about any problem on the SAN? Retransmissions etc? I am not so big expert here but when you utilize something to its saturation what seems to be this case (fibre ports) then might happen whatever.
It would explain that low loads are fine, just loads when fibers are saturated happen something what increases load on one side.
If that is only case when you see any major difference between stor2rrd (back-end) data and VMware/AIX (front-end) data then it is something to consider at least.
What we can do is save original data coming from the storage just to assure that this is reported even by the storage itself.
1.
echo "export KEEP_OUT_FILES=1" > /home/stor2rrd/stor2rrd/etc/.magic
do it before the peak occures, stop it afterwards.
It might running even for longer period, it cause that all data coming from the storage will not be deleted after its processing
2.
collect perf files
cd /home/stor2rrd/stor2rrd
tar cvf d.tar data/<storage>/*perf* data/<storage>/*conf*
gzip -9 d.tar
upload: https://upload.stor2rrd.com
3.
delete .magic file, do not miss it!!
rm /home/stor2rrd/stor2rrd/etc/.magic
-
Hi,
I figured out what the matter in this case. stor2rrd shows bandwidth on back-end. So it might be significantly bigger, depends on raid level. 1 transaction on fronted = 2 transaction on back-end for raid 1.
-
volume perf data is always front-end data in the tool, why do you think it back-end?
-
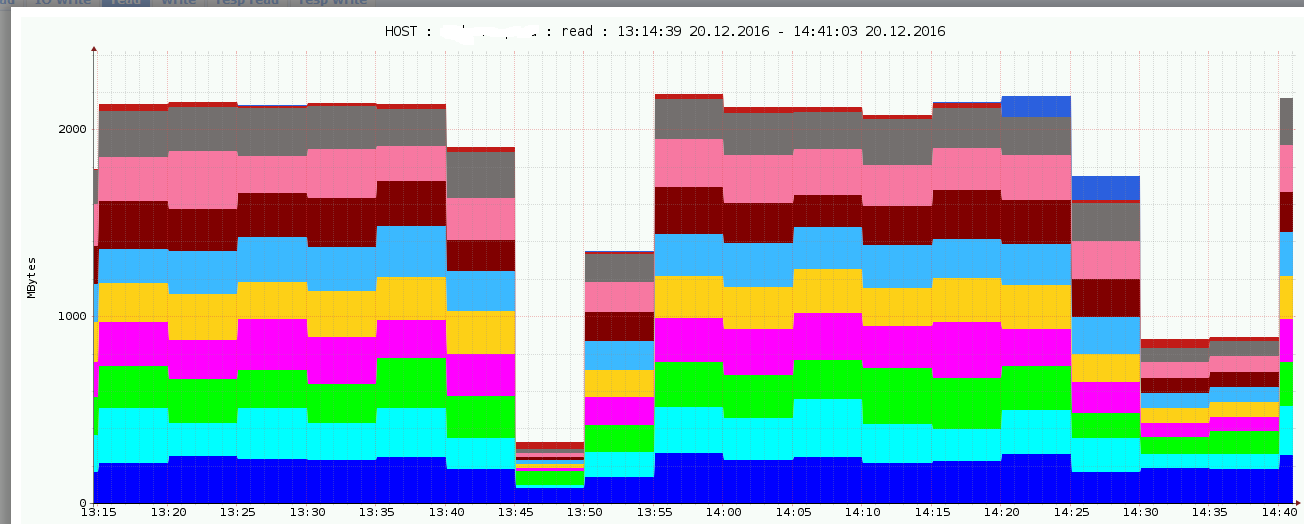
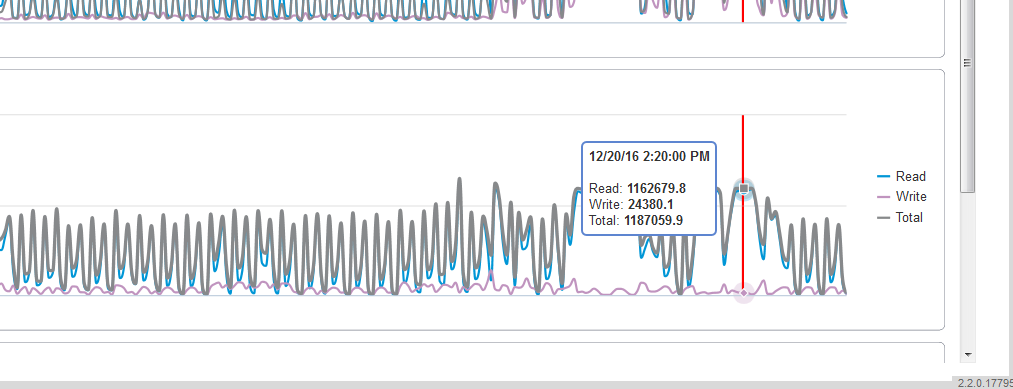
First. today i applied qos to a set of luns. bandwidth limit - 1.2gb/s. And this is what i see. luns in raid1.
Second.
Native 3par monitoring SSMC has 2 types of reports. "Exported Volumes Performance" and "Physical Drive Performance".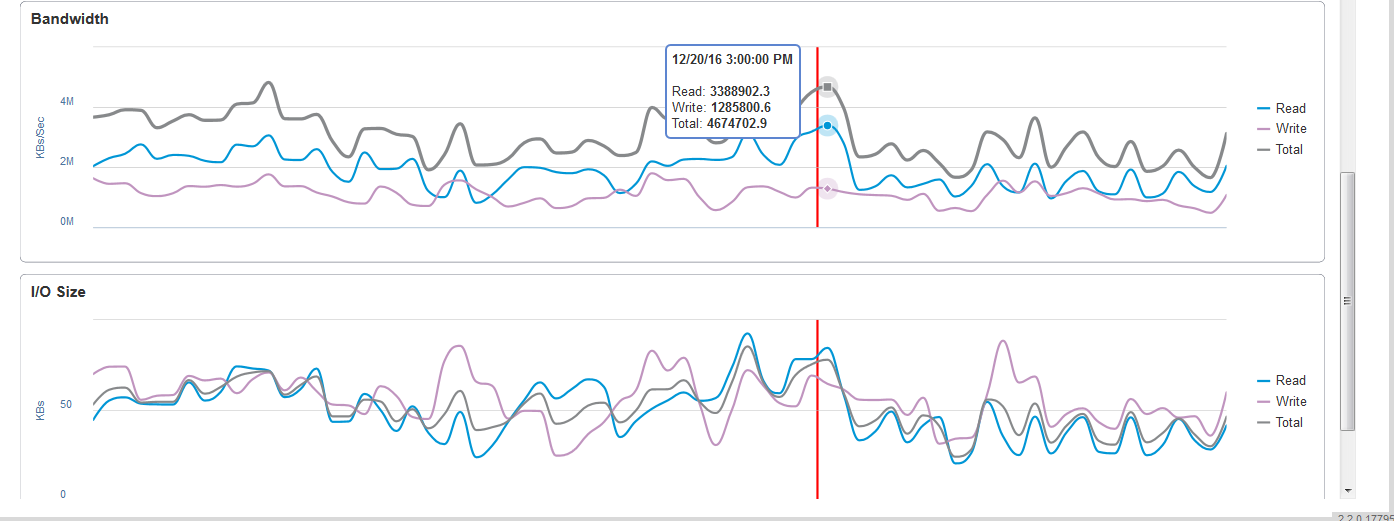

And as you can see, we have higher load on disks, than on lun according to this graphs.
3rd. I added this 3par to IBM TPC monitoring and noticed, that it also shows performance on disks, not real performance which we have on luns
-
Hi,
we have recently review our 3PAR monitoring with some HPE storage specialist and we have found out that we do not monitor it best levels from front-end and back-end point of view.
As the back-end we actually use data from "logical drive" what is one level above disk which seems to be really back-end with RAID overhead etc.
Also on front-end ve monitor vVOL level instead of LUN level which appears to be real front-end.
We are preparing a new version which will fixes above and will have includes further 3PAR related enhancement. Changes will be ready at the end of Feb. We can share it with you if you want to test it (next stable release is planned at the end of March)
Howdy, Stranger!
Categories
- 1.7K All Categories
- 126 XorMon
- 26 XorMon Original
- 176 LPAR2RRD
- 14 VMware
- 20 IBM i
- 2 oVirt / RHV
- 5 MS Windows and Hyper-V
- Solaris / OracleVM
- 1 XenServer / Citrix
- Nutanix
- 8 Database
- 2 Cloud
- 10 Kubernetes / OpenShift / Docker
- 141 STOR2RRD
- 20 SAN
- 7 LAN
- 19 IBM
- 8 EMC
- 12 Hitachi
- 5 NetApp
- 17 HPE
- 1 Lenovo
- 1 Huawei
- 3 Dell
- Fujitsu
- 2 DataCore
- INFINIDAT
- 4 Pure Storage
- Oracle

