graph sample rate

Hi,
We just started monitoring a v5000 and a v7000 storage with the same settings, the sample rate is 5 minutes on both. However the displayed graphs are different in resolution, the graphs of v5000 are fine, seems to have sample in every 5 minutes but the graphs of the v7000 seems to have samples in every 20 minutes.
The v7000 graph:

The v5000 graph:
The measure unit is 1 hour.
What can be the problem? Why the graphs of v7000 are not detailed?
Thanks,
Karoly
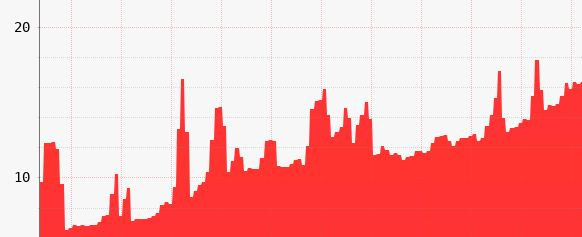
We just started monitoring a v5000 and a v7000 storage with the same settings, the sample rate is 5 minutes on both. However the displayed graphs are different in resolution, the graphs of v5000 are fine, seems to have sample in every 5 minutes but the graphs of the v7000 seems to have samples in every 20 minutes.
The v7000 graph:
The v5000 graph:
The measure unit is 1 hour.
What can be the problem? Why the graphs of v7000 are not detailed?
Thanks,
Karoly
Comments
-
Hi,it cannot be 20 iminutes, it must be 10 minutes, pls confirm it or send a screenshot with time axis visible.It could happen when you initially start with 10 minutes samples, rrdfiless are allocated for 10 minutes sample, switch to 5 mins does not change allocation.You would have to remove all data in data/<storage name> after switch to 5 mins.I hope I ma clear anougld.Checnge from 5 --> 10 minutes is fine, notimg must be removed, just sample rate change
-
Hi,
Thanks for the info, I will remove all the data files.
Will post the result.
Best,
Karoly -
Hi,
After recreating the data files, the resolution is 5 minutes again.
Thanks,
Karoly

Howdy, Stranger!
Categories
- 1.5K All Categories
- 6 XORMON NG
- 24 XORMON
- 123 LPAR2RRD
- 9 VMware
- 12 IBM i
- 1 oVirt / RHV
- 4 MS Windows and Hyper-V
- Solaris / OracleVM
- XenServer / Citrix
- Nutanix
- 6 Database
- 1 Cloud
- 9 Kubernetes / OpenShift / Docker
- 102 STOR2RRD
- 14 SAN
- 6 LAN
- 15 IBM
- 3 EMC
- 10 Hitachi
- 5 NetApp
- 13 HPE
- Lenovo
- 1 Huawei
- 1 Dell
- Fujitsu
- 2 DataCore
- INFINIDAT
- 3 Pure Storage
- Oracle